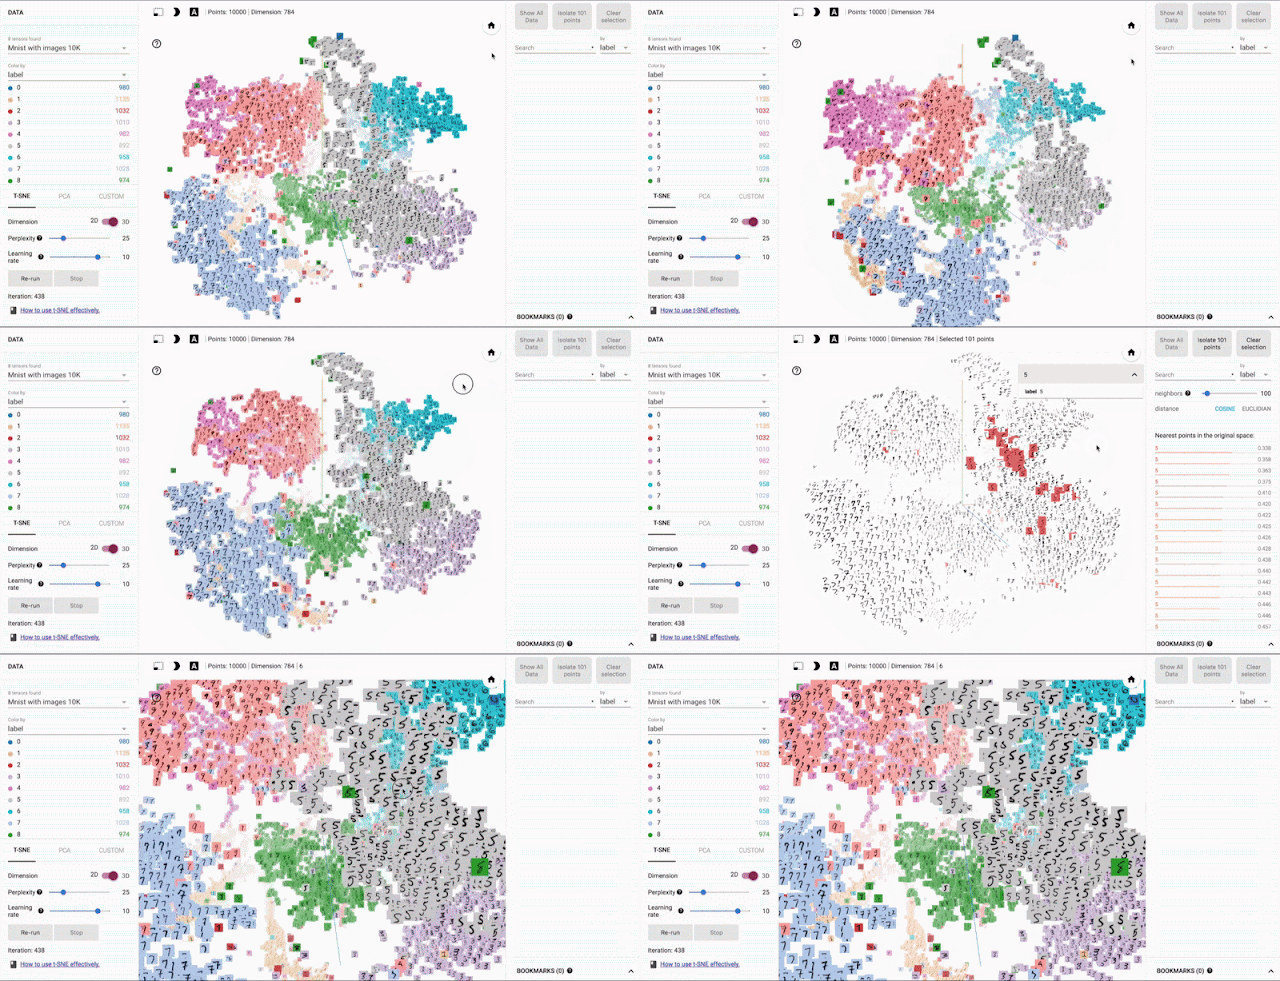
Recent advances in machine learning (ML) have shown impressive results, with applications ranging from image recognition, language translation, medical diagnosis and more. With the widespread adoption of ML systems, it is increasingly important for research scientists to be able to explore how the data is being interpreted by the models. However, one of the main challenges in exploring this data is that it often has hundreds or even thousands of dimensions, requiring special tools to investigate the space.
To enable a more intuitive exploration process, we are open-sourcing the Embedding Projector, a web application for interactive visualization and analysis of high-dimensional data recently shown as an A.I. Experiment, as part of TensorFlow. We are also releasing a standalone version at projector.tensorflow.org, where users can visualize their high-dimensional data without the need to install and run TensorFlow.
Exploring Embeddings
The data needed to train machine learning systems comes in a form that computers don't immediately understand. To translate the things we understand naturally (e.g. words, sounds, or videos) to a form that the algorithms can process, we use embeddings, a mathematical vector representation that captures different facets (dimensions) of the data. For example, in this language embedding, similar words are mapped to points that are close to each other.
With the Embedding Projector, you can navigate through views of data in either a 2D or a 3D mode, zooming, rotating, and panning using natural click-and-drag gestures. Below is a figure showing the nearest points to the embedding for the word “important” after training a TensorFlow model using the word2vec tutorial. Clicking on any point (which represents the learned embedding for a given word) in this visualization, brings up a list of nearest points and distances, which shows which words the algorithm has learned to be semantically related. This type of interaction represents an important way in which one can explore how an algorithm is performing.
Methods of Dimensionality Reduction
The Embedding Projector offers three commonly used methods of data dimensionality reduction, which allow easier visualization of complex data: PCA, t-SNE and custom linear projections. PCA is often effective at exploring the internal structure of the embeddings, revealing the most influential dimensions in the data. t-SNE, on the other hand, is useful for exploring local neighborhoods and finding clusters, allowing developers to make sure that an embedding preserves the meaning in the data (e.g. in the MNIST dataset, seeing that the same digits are clustered together). Finally, custom linear projections can help discover meaningful "directions" in data sets - such as the distinction between a formal and casual tone in a language generation model - which would allow the design of more adaptable ML systems.
 |
| A custom linear projection of the 100 nearest points of "See attachments." onto the "yes" - "yeah" vector (“yes” is right, “yeah” is left) of a corpus of 35k frequently used phrases in emails |
The Embedding Projector website includes a few datasets to play with. We’ve also made it easy for users to publish and share their embeddings with others (just click on the “Publish” button on the left pane). It is our hope that the Embedding Projector will be a useful tool to help the research community explore and refine their ML applications, as well as enable anyone to better understand how ML algorithms interpret data. If you'd like to get the full details on the Embedding Projector, you can read the paper here. Have fun exploring the world of embeddings!

