
opensource.google.com

Menu
Showing posts with label Cloud. Show all posts

Get ready for Google I/O: Program lineup revealed

Wednesday, April 23, 2025

The Google I/O agenda is live. We're excited to share Google’s biggest announcements across AI, Android, Web, and Cloud May 20-21. Tune in to learn how we’re making development easier so you can build faster.

We'll kick things off with the Google Keynote at 10:00 AM PT on May 20th, followed by the Developer Keynote at 1:30 PM PT. This year, we're livestreaming two days of sessions directly from Mountain View, bringing more of the I/O experience to you, wherever you are.

Here’s a sneak peek of what we’ll cover:

    • AI advancements: Learn how Gemini models enable you to build new applications and unlock new levels of productivity. Explore the flexibility offered by options like our Gemma open models and on-device capabilities.
    • Build excellent apps, across devices with Android: Crafting exceptional app experiences across devices is now even easier with Android. Dive into sessions focused on building intelligent apps with Google AI and boosting your productivity, alongside creating adaptive user experiences and leveraging the power of Google Play.
    • Powerful web, made easier: Exciting new features continue to accelerate web development, helping you to build richer, more reliable web experiences. We’ll share the latest innovations in web UI, Baseline progress, new multimodal built-in AI APIs using Gemini Nano, and how AI in DevTools streamline building innovative web experiences.

Plan your I/O

Join us online for livestreams May 20-21, followed by on-demand sessions and codelabs on May 22. Register today and explore the full program for sessions like these:

We're excited to share what's next and see what you build!

By the Google I/O team

A Robust Open Ecosystem for All: Accelerating AI Infrastructure

Tuesday, December 3, 2024


JAX now runs on AWS Trainium: Open Source Fuels AI Innovation

Open source software is the foundation of machine learning. It accelerates innovation through an ethos of flexibility and collaboration. This philosophy drives the open development of JAX, our high-performance array computing library, as well as OpenXLA, the compiler and runtime infrastructure it relies on.

Today we're excited to highlight how this commitment to openness, together with JAX and OpenXLA's modular designs, enables seamless integration of AWS Trainium and Trainium2 chips accelerators into the JAX ecosystem. Users get more portability, more choice, and faster progress.


JAX and OpenXLA, abstraction and modularity

JAX is a Python library for high-performance, large-scale numerical computing and machine learning. Its unique compiler-oriented design makes numerical computation familiar and portable while also accelerator-friendly and scalable. It combines a NumPy-like API with composable transformations for automatic differentiation, vectorization, parallelization, and more. Under the hood, JAX leverages the XLA compiler to optimize and scale computations over a broad set of backends.

This abstraction layer is key to its portability: JAX presents a consistent interface while XLA optimizes performance, whether you're running on CPUs, GPUs, TPUs, or something new.

In fact, OpenXLA infrastructure is designed to be modular and extensible to new platforms. By developing a PJRT plugin and leveraging existing XLA compiler components, JAX code can target new platforms, even when scaling from a single device to thousands.


Enter AWS Trainium and Inferentia

We are excited to announce that AWS Trainium is the latest platform to embrace JAX and OpenXLA. With the JAX Neuron plugin, AWS Trainium and Inferentia can be used as native JAX devices.

This new backend demonstrates how abstraction and modularity make JAX and OpenXLA especially extensible and amenable to collaboration, even on new hardware. We're thrilled to have diverse hardware partners like AMD, Arm, Intel, Nvidia, and AWS taking advantage of JAX's portability and performance. If you're interested in bringing new platforms into the JAX and OpenXLA ecosystem, please reach out!

A multi-platform ecosystem fosters open collaboration in advancing AI infrastructure. Our goal is to drive continuous development of open standards and to accelerate progress. And if you're a machine learning developer or numerical computing user, we're excited for you to try JAX on any platform you choose.

By Matthew Johnson - Principal Scientist, with additional contributors: Aditi Joshi, Fenghui Zhang, Roy Frostig, and Carlos Araya

Driving etcd Stability and Kubernetes Success

Thursday, June 13, 2024


Introduction: The Critical Role of etcd in Cloud-Native Infrastructure

Imagine a cloud-native world without Kubernetes. It's hard, right? But have you ever considered the unsung hero that makes Kubernetes tick? Enter etcd, the distributed key-value store that serves as the central nervous system for Kubernetes. Etcd's ability to consistently store and replicate critical cluster state data is essential for maintaining the health and harmony of distributed systems.


etcd: The Backbone of Kubernetes

Think of Kubernetes as a magnificent vertebrate animal, capable of complex movements and adaptations. In this analogy, etcd is the animal's backbone – a strong, flexible structure that supports the entire system. Just as a backbone protects the spinal cord (which carries vital information), etcd safeguards the critical data that defines the Kubernetes environment. And just as a backbone connects to every other part of the body, etcd facilitates communication and coordination between all the components of Kubernetes, allowing it to move, adapt, and thrive in the dynamic world of distributed systems.

ALT TEXT
Credit: Original image xkcd.com/2347, alterations by Josh Berkus.

Google's Deep-Rooted Commitment to Open Source

Google has a long history of contributing to open source projects, and our commitment to etcd is no exception. As the initiator of Kubernetes, Google understands the critical role that etcd plays in its success. Google engineers consistently invest in etcd to enhance its functionality and reliability, driven by their extensive use of etcd for their own internal systems.


Google's Collaborative Impact on etcd Reliability

Google engineers have actively contributed to the stability and resilience of etcd, working alongside the wider community to address challenges and improve the project. Here are some key areas where their impact has been felt:

Post-Release Support: Following the release of etcd v3.5.0, Google engineers quickly identified and addressed several critical issues, demonstrating their commitment to maintaining a stable and production-ready etcd for Kubernetes and other systems.

Data Consistency: Early Detection and Swift Action: Google engineers led efforts to identify and resolve data inconsistency issues in etcd, advocating for public awareness and mitigation strategies. Drawing from their Site Reliability Engineering (SRE) expertise, they fostered a culture of "blameless postmortems" within the etcd community—a practice where the focus is on learning from incidents rather than assigning blame. Their detailed postmortem of the v3.5 data inconsistency issue and a co-presented KubeCon talk served to share these valuable lessons with the broader cloud-native community.

Refocusing on Stability and Testing: The v3.5 incident highlighted the need for more comprehensive testing and documentation. Google engineers took action on multiple fronts:

  • Improving Documentation: They contributed to creating "The Implicit Kubernetes-ETCD Contract," which formalizes the interactions between the two systems, guiding development and troubleshooting.
  • Prioritizing Stability and Testing: They developed the "etcd Robustness Tests," a rigorous framework simulating extreme scenarios to proactively identify inconsistency and correctness issues.

These contributions have fostered a collaborative environment where the entire community can learn from incidents and work together to improve etcd's stability and resilience. The etcd Robustness Tests have been particularly impactful, not only reproducing all the data inconsistencies found in v3.5 but also uncovering other bugs introduced in that version. Furthermore, they've found previously unnoticed bugs that existed in earlier etcd versions, some dating back to the original v3 implementation. These results demonstrate the effectiveness of the robustness tests and highlight how they've made etcd the most reliable it has ever been in the history of the project.


etcd Robustness Tests: Making etcd the Most Reliable It's Ever Been

The "etcd Robustness Tests," inspired by the Jepsen methodology, subject etcd to rigorous simulations of network partitions, node failures, and other real-world disruptions. This ensures etcd's data consistency and correctness even under extreme conditions. These tests have proven remarkably effective, identifying and addressing a variety of issues:

For deeper insights into ensuring etcd's data consistency, Marek Siarkowicz's talk, "On the Hunt for Etcd Data Inconsistencies," offers valuable information about distributed systems testing and the innovative approaches used to build these tests. To foster transparency and collaboration, the etcd community holds bi-weekly meetings to discuss test results, open to engineers, researchers, and other interested parties.


The Kubernetes-etcd Contract: A Partnership Forged in Rigorous Testing

To solidify the Kubernetes-etcd partnership, Google engineers formally defined the implicit contract between the two systems. This shared understanding guided development and troubleshooting, leading to improved testing strategies and ensuring etcd meets Kubernetes' demanding requirements.

When subtle issues were discovered in how Kubernetes utilized etcd watch, the value of this formal contract became clear. These issues could lead to missed events under specific conditions, potentially impacting Kubernetes' operation. In response, Google engineers are actively working to integrate the contract directly into the etcd Robustness Tests to proactively identify and prevent such compatibility issues.


Conclusion: Google's Continued Commitment to etcd and the Cloud-Native Community

Google's ongoing investment in etcd underscores their commitment to the stability and success of the cloud-native ecosystem. Their contributions, along with the wider community's efforts, have made etcd a more reliable and performant foundation for Kubernetes and other critical systems. As the ecosystem evolves, etcd remains a critical linchpin, empowering organizations to build and deploy distributed applications with confidence. We encourage all etcd and Kubernetes contributors to continue their active participation and contribute to the project's ongoing success.

By Marek Siarkowicz – GKE etcd

Get ready for Google I/O: Program lineup revealed

Wednesday, May 1, 2024


Developers, get ready! Google I/O is just around the corner, kicking off live from Mountain View with the Google keynote on Tuesday, May 14 at 10 am PT, followed by the Developer keynote at 1:30 pm PT.

But the learning doesn’t stop there. Mark your calendars for May 16 at 8 am PT when we’ll be releasing over 150 technical deep dives, demos, codelabs, and more on-demand. If you register online, you can start building your 'My I/O' agenda today.

Here's a sneak peek at some of the exciting highlights from the I/O program preview:

Unlocking the power of AI: The Gemini era unlocks a new frontier for developers. We'll showcase the newest features in the Gemini API, Google AI Studio, and Gemma. Discover cutting-edge pre-trained models from Kaggle, and delve into Google's open-source libraries like Keras and JAX.

Android: A developer's playground: Get the latest updates on everything Android! We'll cover groundbreaking advancements in generative AI, the highly anticipated Android 15, innovative form factors, and the latest tools and libraries in the Jetpack and Compose ecosystem. Plus, discover how to optimize performance and streamline your development workflow.

Building beautiful and functional web experiences: We’ll cover Baseline updates, a revolutionary tool that empowers developers with a clear understanding of web features and API interoperability. With Baseline, you'll have access to real-time information on popular developer resource sites like MDN, Can I Use, and web.dev.

The future of ChromeOS: Get a glimpse into the exciting future of ChromeOS. We'll discuss the developer-centric investments we're making in distribution, app capabilities, and operating system integrations. Discover how our partners are shaping the future of Chromebooks and delivering world-class user experiences.

This is just a taste of what's in store at Google I/O. Stay tuned for more updates, and get ready to be a part of the future.

Don't forget to mark your calendars and register for Google I/O today!

Posted by Timothy Jordan – Director, Developer Relations and Open Source

Kubernetes 1.29 is available in the Regular channel of GKE

Wednesday, February 7, 2024

Kubernetes 1.29 is now available in the GKE Regular Channel since January 26th, and was available in the Rapid Channel January 11th, less than 30 days after the OSS release! For more information about the content of Kubernetes 1.29, read the Kubernetes 1.29 Release Notes.

New Features

Using CEL for Validating Admission Policy

Validating admission policies offer a declarative, in-process alternative to validating admission webhooks.

Validating admission policies use the Common Expression Language (CEL) to declare the validation rules of a policy. Validation admission policies are highly configurable, enabling policy authors to define policies that can be parameterized and scoped to resources as needed by cluster administrators. [source]

Validating Admission Policy graduates to beta in 1.29. We are especially excited about the work that Googlers Cici Huang, Joe Betz, and Jiahui Feng have led in this release to get to the beta milestone. As we move toward v1, we are actively working to ensure scalability and would appreciate any end-user feedback. [public doc here for those interested]

The beta of ValidatingAdmissionPolicy feature can be opted into by enabling the beta APIs.

InitContainers as a Sidecar

InitContainers can now be configured as sidecar containers and kept running alongside normal containers in a Pod. This is only supported by nodes running version 1.29 or later, so ensure all nodes in a cluster are at version 1.29 or later before using this feature in Pods. The feature was long awaited. This is evident by the fact that Istio has already widely tested it and the Istio community working hard to make sure that the enablement of it can be done early with minimal disruption for the clusters with older nodes. You can participate in the discussion here.

A big driver to deliver the feature is the growing number of AI/ML workloads which are often represented by Pods running to completion. Thos Pods need infrastructure sidecars - Istio and GCSFuse are examples of it, and Google recognizes this trend.

Implementation of sidecar containers is and continues to be the community effort. We are proud to highlight that Googler Sergey Kanzhelev is driving it via the Sidecar working group, and it was a great effort of many other Googlers to make sure this KEP landed so fast. John Howard made sure the early versions of implementation were tested with Istio, Wojciech Tyczyński made sure the safe rollout vie production readiness review, Tim Hockin spent many hours in API review of the feature, and Clayton Coleman gave advice and helped with code reviews.

New APIs

API Priority and Fairness/Flow Control

We are super excited to share that API Priority and Fairness graduated to Stable V1 / GA in 1.29! Controlling the behavior of the Kubernetes API server in an overload situation is a key task for cluster administrators, and this is what APF addresses. This ambitious project was initiated by Googler and founding API Machinery SIG lead Daniel Smith, and expanded to become a community-wide effort. Special thanks to Googler Wojciech Tyczyński and API Machinery members Mike Spreitzer from IBM and Abu Kashem from RedHat, for landing this critical feature in Kubernetes 1.29 (more details in the Kubernetes publication). In Google GKE we tested and utilized it early. In fact, any version above 1.26.4 is setting higher kubelet QPS values trusting the API server to handle it gracefully.

Deprecations and Removals

  • The previously deprecated v1beta2 Priority and Fairness APIs are no longer served in 1.29, so update usage to v1beta3 before upgrading to 1.29.
  • With the API Priority and Fairness graduation to v1, the v1beta3 Priority and Fairness APIs are newly deprecated in 1.29, and will no longer be served in 1.32.
  • In the Node API, take a look at the changes to the status.kubeProxyVersion field, which will not be populated starting in v1.33. The field is currently populated with the kubelet version, not the kube-proxy version, and might not accurately reflect the kube-proxy version in use. For more information, see KEP-4004.
  • 1.29 removed support for the insecure SHA1 algorithm. To prevent impact on your clusters, you must replace incompatible certificates of webhook servers and extension API servers before upgrading your clusters to version 1.29.
    • GKE will not auto-upgrade clusters with webhook backends using incompatible certificates to 1.29 until you replace the certificates or until version 1.28 reaches end of life. For more information refer to the official GKE documentation.
  • The Ceph CephFS (kubernetes.io/cephfs) and RBD (kubernetes.io/rbd) volume plugins are deprecated since 1.28 and will be removed in a future release

Shoutout to the Production Readiness Review (PRR) team

For each new Kubernetes Release, there is a dedicated sub group of SIG Architecture, composed of very senior contributors in the Kubernetes Community, that regularly conducts Production Readiness reviews for each new release, going through each feature.

  • OSS Production Readiness Reviews (PRR) reduce toil for all the different Cloud Providers, by shifting the effort onto OSS developers.
  • OSS Production Readiness Reviews surface production safety, observability, and scalability issues with OSS features at design time, when it is still possible to affect the outcomes.
  • By ensuring feature gates, solid enable → disable → enable testing, and attention to upgrade and rollout considerations, OSS Production Readiness Reviews enable rapid mitigation of failures in new features.

As part of this group, we want to thank Googlers John Belamaric and Wojciech Tyczyński for doing this remarkable, heavy lifting on non shiny, and often invisible work. Additionally, we’d like to congratulate Googler Joe Betz who recently graduated as a new PRR reviewer, after shadowing during all 2023 the process.

By Jordan Liggitt, Jago Macleod, Sergey Kanzhelev, and Federico Bongiovanni – Google Kubernetes Kernel team

Finding Stability in Open Source Work

Wednesday, October 25, 2023

At Google, open source is at the core of our infrastructure, processes, and culture. For the last 19 years, Google’s Open Source Programs Office (OSPO) has enabled our organization to support open source ecosystems through funding, training, mentorship and direct contribution. Every year for the last 5 years, roughly 10% of our workforce has contributed to open source projects as part of their work as well as in their personal time. We’re focused on investing in and protecting open source communities and infrastructure, as well as expanding access to open source opportunities around the world. Every day we seek to promote open and connected ecosystems as the foundation of technological advancement.

For the last four years, researchers in Google's Open Source Programs Office (OSPO) have analyzed our open source contribution activity annually to identify trends and changes in behavior. The goal of this effort has been to increase transparency and accountability across all of the communities we engage with, as well as provide feedback indicators for Alphabet’s internal tools, processes, and policies. In this iteration, our 2022 open source contribution metrics were remarkably consistent with what we found in 2021, which gives us confidence that what we're measuring is a good representation of open source behavior, especially after the extreme outlier year of 2020.


Security remains a priority

At Alphabet, open source software remains a critical component of our infrastructure, products, and services and we continue to rely on the health and availability of open source projects. Through internal efforts and collaboration with industry-led efforts such as OpenSSF, Alphabet is committed to bolstering the security posture of projects, users, and developers of open source software.

In 2021, Google began funding two Linux Foundation contractors to focus exclusively on security, and in 2022 we've continued to sponsor their work to eliminate fragile C language features and APIs in the kernel. We also continue to support the Rust-in-Linux project, with the goal of improving memory safety, strengthening APIs, and reducing the number of bugs overall in the project. In late 2022, Rust infrastructure support landed in the upstream kernel.

The deps.dev project released a public BigQuery dataset, allowing anyone to explore and analyze the dependencies, advisories, ownership, license, and other metadata of open source packages across supported ecosystems, and explore how this metadata has changed over time.

In 2022 we announced:

  • The OSV-Scanner, a free tool enabling open source developers and users to identify and remediate known vulnerabilities in their project's OSS dependencies. The OSV-Scanner provides a supported frontend to the OSV database which connects a project’s list of dependencies with the vulnerabilities that affect them.
  • The GOSST Upstream Team, a dedicated staff of Google open source security engineers who spend 100% of their time working closely with upstream maintainers to improve the security of critical open source projects.
  • Graph for Understanding Artifact Composition (GUAC) which aggregates software security metadata into a high fidelity graph database–normalizing entity identities and mapping standard relationships between them.

Our contributions continue to scale with our growing workforce

In 2022, roughly 10% of Alphabet's full-time workforce contributed to open source projects hosted on GitHub or Git-on-Borg - our internal production Git service (more details below). This percentage has remained roughly consistent over the last five years, indicating that our open source contribution has continued to scale with the growth of Alphabet. Similar to last year, FTEs represented over 95% of our open source workers, while the remainder includes vendors, independent contractors, temporary staff, and interns who contributed to open source projects during their tenure at Alphabet.

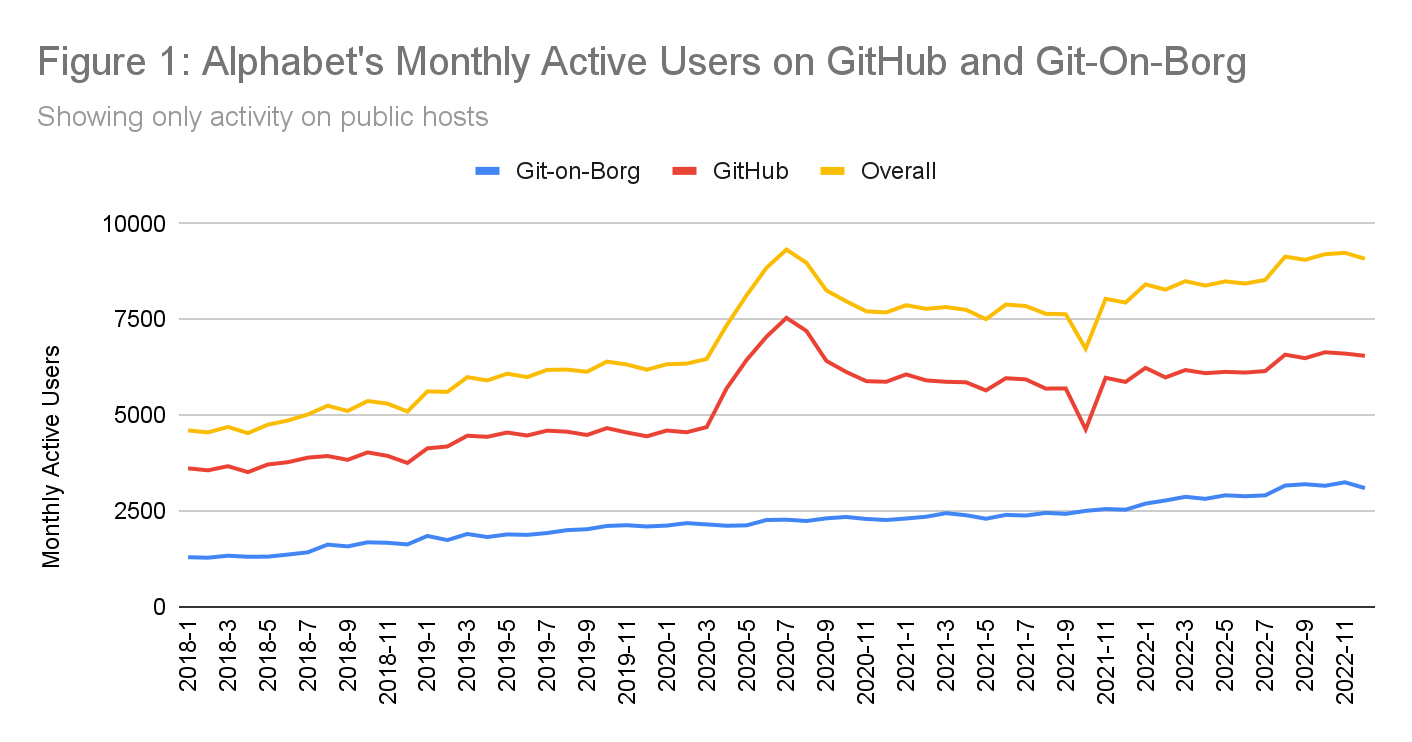
As open source work is core to our ongoing operations, we continue to track engagement over time, helping to compare continuous and sporadic participation. On average, over 45% of our active* contributing population for the year logged an activity on GitHub or Git-on-Borg in an average month. (see Figure 1)
This chart shows Alphabet's monthly active users on GitHub and Git-on-Borg. Over the last five years, the trajectory of monthly active users has continued to increase on both GitHub and Git-on-Borg by more than 15% year over year per month

Our portfolio of projects remains active

We estimate that more than 2000 projects that originated from Alphabet teams and employees were still active* (not archived). To make this estimate, we chose a broad and variable definition of an open source project, including developer tools, utilities, languages, frameworks, libraries, demos, sample code, models, raw data, designs, and more.

Project counts should not be confused with repositories as projects can include many repositories. Within Alphabet, we maintain over 7500 public repositories on GitHub and 1600 public repositories on Git-on-Borg. Our total repositories under management have reduced over time with the enforcement of a new archiving policy that flags repositories for archiving based on activity levels and owner feedback. Most of these repositories are open to outside contribution: more than 500,000 unique GitHub accounts not affiliated with Alphabet workers contributed to Alphabet projects in 2022.

The majority of our open source work happens outside of Alphabet organizations

The majority of repositories we work on are outside of Alphabet organizations: Over the last five years, more than 70% of non-personal GitHub repositories Alphabet contributors interacted with were outside of Google-managed organizations. We updated the methodology behind this metric since our last edition to filter out forks created in the pull request workflow. The top projects (by unique contributors at Alphabet) include Google-initiated projects such as Kuberenetes, Apache Beam, and gRPC as well as community-led projects such as LLVM, Envoy, and Rust.


We continue to invest in the sustainability of open source ecosystems

The mission of the Google Open Source Programs Office remains the same: we sponsor, create, and invest in projects and programs that enable everyone to join and contribute to the global open source ecosystem. In 2022, OSPO provided $5.7M in membership fees and sponsorship funding to 60 key open source projects and organizations. This funding was in addition to our established annual programs:

  • In its 18th year, Google Summer of Code enabled more than 1000 individuals to contribute to more than 150 organizations. Over the lifetime of this program, more than 19,000 individuals from 112 countries have contributed to more than 800 open source organizations across the globe.
  • In its fourth year, Google Season of Docs provided direct grants to 30 open source projects to hire more than 50 technical writers to improve open source project documentation, and published its second case study report highlighting useful open source documentation metrics. More than half of the documentation created in the 2022 program were how-tos, tutorials, and reference documentation; projects primarily wanted to add documentation for missing use cases and fix disorganized documentation.
  • Since 2011, the Google Open Source Peer Bonus Program has awarded bonuses for open source contributions to members of our extended community. In 2022 more than 300 contributors received awards, working in over 40 countries on more than 200 open source projects.

Our open source work will continue to grow and evolve to support the changing needs of our communities. Thank you to our colleagues and community members who continue to dedicate their personal and professional time supporting the open source ecosystem. Follow our work at opensource.google.

By Sophia Vargas – Researcher, Google Open Source Programs Office


About this data:

This report features metrics provided by many teams and programs across Alphabet. In regards to the code and code-adjacent activities data, we wanted to share more details about the derivation of those metrics.

2022 updates: This year, we decided to remove event counts as it is increasingly difficult to differentiate automated activities from human-centered work. Even after filtering out non-human accounts, we couldn’t correlate these events to employee time spent on open source projects, and so we reduced our reporting to focus on our population and scope of effort.

  • Data sources: These data represent activities on repositories hosted on GitHub and our internal production Git service Git-on-Borg. These sources represent a subset of open source activity currently tracked by Google OSPO.
    • GitHub: We continue to use GitHub Archive as the primary source for GitHub data, which is available as a public dataset on BigQuery. Alphabet activity within GitHub is identified by self-registered accounts, which we estimate underreports actual activity.
    • Git-on-Borg: This is our primary platform for internal projects and some of our larger, long running public projects such as Android and Chromium. While we continue to develop on this platform, most of our open source activity has moved to GitHub to increase exposure and encourage community growth.
    • Distinct event types: Note that Git-on-Borg and GitHub APIs produce distinct sets of events—so we report activity metrics per platform. Where GitHub Event logs capture a wide range of activity from code creation and review to issue creation and comments, the Gerrit Event stream (used by Git-on-Borg) only captures code changes and reviews.
  • Driven by humans: We have created many automated bots and systems that can propose changes on various hosting platforms. We have intentionally filtered these data to focus on human-initiated activities.
  • Business and personal: Activity on GitHub reflects a mixture of Alphabet projects, third party projects, experimental efforts, and personal projects. Our metrics report on all of the above unless otherwise specified.
  • Alphabet contributors: Please note that unless additional detail is specified, activity counts attributed to Alphabet open source contributors will include our full-time employees as well as our extended Alphabet community (temps, vendors, contractors, and interns).
  • GitHub Accounts: For counts of GitHub accounts not affiliated with Alphabet, we cannot assume that one account is equivalent to one person, as multiple accounts could be tied to one individual or bot account.
  • *Active counts: Where possible, we will show ‘active users’ defined by logged activity (excluding ‘WatchEvent’) within a specified timeframe (a month, year, etc.) and ‘active repositories’ and ‘active projects’ as those that have enough activity to meet our internal criteria and have not been archived.

A vision for more efficient media management

Monday, July 31, 2023

Petit Press’ new open source, cloud-based DAM platform helps publishers get rich media content in front of their audience at pace and scale.

Picture the scene: You’re an investigative journalist that has just wrapped up a new piece of video content that offers incisive, timely commentary on a pressing issue of the day. Your editor wants to get the content in front of your audience as quickly as possible and you soon find yourself bogged down in a laborious, manual process of archiving and uploading files. A process that is subject to human error, and involves repeating the same tasks as you prepare the content for YouTube and embedding within an article.

With the development of a new open source digital asset management (DAM) system, Slovak publishing house, Petit Press, is hoping to help the wider publishing ecosystem overcome these types of challenges.

Striving towards a universal, open source solution

Like many publishers in today’s fast-paced, fast-changing news landscape, Petit Press was feeling the pressure to be more efficient and do more with less, while at the same time maximizing the amount of high-quality, rich media content its journalists could deliver. “We wanted to find a solution to two main asset delivery issues in particular,” says Ondrej Podstupka, deputy editor in chief of SME.sk. “Firstly, to reduce the volume of work involved in transferring files from our journalists to our admin teams to the various platforms and CMS we use. Secondly, to avoid the risk of misplacing archived files or losing them entirely in an archive built on legacy technologies.”

As a publisher of over 35 print and digital titles, including one of Slovakia’s most-visited news portal, SME.sk, Petit Press also had a first-hand understanding of how useful the solution might be if it could flex to the different publishing scales, schedules, and platforms found across the news industry. With encouragement and support from GNI, Petit Press challenged themselves to build an entirely open source, API-based DAM system that flexes beyond their own use cases and can be easily integrated with any CMS, which means that other publishers can adapt and add functionality with minimal development costs.

Getting out of the comfort zone to overcome complexity

For the publisher, creating an open source project requires collaboration, skill development, and a strong sense of purpose. GNI inspired our team members to work together in a positive, creative, and supportive environment. Crucial resources from GNI also enabled the team to broaden the scope of the project beyond Petit Press’ direct requirements to cover the edge use cases and automations that a truly open source piece of software requires.

“GNI has enabled our organization to make our code open source, helping to create a more collaborative and innovative environment in the media industry.” 
– Ondrej Podstupka, deputy editor in chief of SME.sk

Building and developing the tool was difficult at times with a team of software engineers, product managers, newsroom managers, UX designers, testers, and cloud engineers all coming together to see the project to completion. For a team not used to working on GitHub, the open source aspect of the project proved the primary challenge. The team, however, also worked to overcome everything from understanding the complexities of integrating a podcast feature, to creating an interface all users felt comfortable with, to ensuring compliance with YouTube’s security requirements.

Unburdening the newsroom and minimizing costs

The hard work paid off though, when the system initially launched in early 2023. Serving as a unified distribution platform, asset delivery service and long term archive, the single solution is already unburdening the newsroom. It also benefits the tech/admin teams, by addressing concerns about the long-term costs of various media storage services.

On Petit Press’ own platforms, the DAM system has already been successfully integrated into SME.sk’s user-generated content (UGC) blog. This integration allows for seamless content management and curation, enhancing the overall user experience. The system also makes regulatory compliance easier, thanks to its GDPR-compliant user deletion process.

In addition to the UGC Blog system, the DAM system has now launched for internal Petit Press users—specifically for managing video and podcast content, which has led to increased efficiency and organization within the team. By streamlining the video and podcast creation and distribution processes, Petit Press has already seen a 5-10% productivity boost. The new DAM system saves an estimated 15-20 minutes of admin time off every piece of video/podcast content Petit Press produces.

Working towards bigger-picture benefits

Zooming out, the DAM system is also playing a central part in Petit Press’ year-long, org-wide migration to the cloud. This transformation was set in motion to enhance infrastructure, streamline processes, and improve overall efficiency within the department.

Podstupka also illustrates how the system might benefit other publishers. “It could be used as an effective standalone, automated archive for videos and podcasts,” he says. For larger publishing houses, “if you use [the DAM system] to distribute videos to YouTube and archive podcasts, there is minimal traffic cost and very low storage cost. But you still have full control over the content in case you decide to switch to a new distribution platform or video hosting service.”

As the team at Petit Press continues to get to grips with the new system, there is a clear goal in mind: To have virtually zero administrative overhead related to audio or video.

Beyond the automation-powered efficiency savings, the team at Petit Press are also exploring the new monetisation opportunities that the DAM system presents. They are currently working on a way to automatically redistribute audio and image assets to their video hosting platform, to automatically create video from every podcast they produce. This video is then pushed to their CMS and optimized for monetisation on the site with very little additional development required.

Ultimately, though, the open source nature of the system makes the whole team excited to see where other publishers and developers might take the product. “It’s a futureproof way to leverage media content with new services, platforms and ideas that emerge in technology or media landscapes,” says Igor, Head Of Development & Infrastructure. A succinct, but undeniably compelling way of summing up the system’s wide-ranging potential.

A guest post by the Petit Press team

Knative applies to become a CNCF incubating project

Tuesday, November 30, 2021

Image of the Knative logo

In 2018, the Knative project was founded and released by Google, and was subsequently developed in close partnership with IBM, Red Hat, VMware, and SAP. The project provides a serverless experience layer on Kubernetes, providing the building blocks you need to build and deploy modern, container-based serverless applications. Over the last three years, Knative has become the most widely-installed serverless layer on Kubernetes. More recently, Knative 1.0 was released, reaching an important milestone that was made possible thanks to the contributions and collaboration of over 600 developers in the community.

Google has worked closely with key maintainers and partners on the evolution of Knative, including conformance definition and stability ahead of the 1.0 milestone. To enable the next phase of community-driven innovation in Knative, today we have submitted Knative to the Cloud Native Computing Foundation (CNCF) for consideration as an incubating project, which begins the process to donate the Knative trademark, IP, and code.

As a leader in serverless computing, we’re committed to the future of Knative, and offering Knative 1.0 conformant Cloud Run and Cloud Run For Anthos products. Finding a home in the CNCF secures Knative’s long-term future and encourages continuing and open innovation. This donation recognizes the adoption and investment in Knative from the community, and will encourage further multi-vendor innovation, broader education and training.

At Google, we believe that using open source comes with a responsibility to contribute, sustain, and improve the projects that help drive innovation and make better software. We are excited to see how developers will continue to build and innovate in serverless using Knative.

By Alexandra Bush and Edd Wilder-James, Google Open Source

Four areas of open source contributions from Cloud Databases

Tuesday, October 26, 2021

Open Cloud enables you to develop software faster, innovate more easily, and scale more efficiently—while also reducing technology risk. Google has a long history of leadership in open source, and today, I want to look back at our activities around open source projects, for databases, over the past year.

Give developers the best tools to be efficient

Developers choose to build applications with managed database services on Google Cloud to benefit from velocity, scalability, security, and performance. To enable you to be most efficient and deliver your best possible work, we deliver tools and frameworks that work with your preferred development environments, no matter if you develop in the cloud or on premises. To make local testing, building and continuous integration easier for our cloud-native databases, we released emulators for Cloud Spanner, Firestore, and Cloud Bigtable so that you can test your code wherever you develop it - without the need to create or re-create cloud infrastructure with every test run.

Another area where we are helping developers is with instrumentation of Cloud SQL for easier debugging and performance tuning. With Cloud SQL Insights it is easier than ever to pinpoint underperforming SQL statements. That said, without additional instrumentation, it can be cumbersome to identify the source code or microservice that issued that SQL - let alone tying a SQL statement to a client session and its context. So we released Sqlcommenter as an open source library that will automatically add this instrumentation as SQL comments in queries that are generated by popular ORMs like Hibernate, Django, Sqlalchemy, and others (repo blog). We didn’t stop there, but merged Sqlcommenter with OpenTelemetry (blog) to add SQL insights from instrumented queries back to OpenTelemetry traces.

Lastly, we want to broaden access to our differentiated offerings, like Spanner. The recently announced Spanner PostgreSQL interface allows organizations to access Spanner’s industry-leading consistency and availability at scale using tools and skills from the popular PostgreSQL ecosystem. This new way of working with Spanner provides familiarity for developers and portability for administrators. (blog) Learn more in the documentation or sign up for the preview today.

Provide connectivity that is simple and secure

Connecting to APIs and databases from an application running in the cloud should be simple and secure. That’s why we recommend using IAM and Application Default Credentials when authenticating to other services. The Cloud SQL Proxy (repo) has been doing this and also setting up firewalls for you for a while. It works by running a local client either inside your VM or a GKE cluster. This year, we added libraries for Java (repo) and Python (repo) that can provide similar functionality without the overhead of running an extra client such as the proxy.

Cloud Spanner also offers an open source adapter for its new PostgreSQL interface (repo). This local proxy allows tools, starting with psql, to connect to a Spanner database using the PostgreSQL wire protocol.

Image 1: White pipes in datacenter

Manage cloud infrastructure with the tools of your choice

When it comes to provisioning, monitoring, and managing your cloud database services, flexibility and choice are important. We provide you with our cloud console, gcloud cli, and APIs as well as our own Deployment Manager. That said, you may prefer different ways to manage cloud infrastructure - whether through interactive tools or scripts or embedded into CI/CD pipelines that support GitOps or other controls, checks, and balances. Terraform is one of those open tools that is very popular - and we ensure that our cloud databases can be managed from it as documented in this blog about creating Spanner instances with Terraform.

If you manage the majority of your resources with Kubernetes either directly or through package managers like Helm, then our Kubernetes Config Connector (KCC) might be for you. In a nutshell, KCC exposes Google Cloud services such as Cloud SQL, Spanner, and others as Custom Resources in Kubernetes. This allows you to create and reconcile cloud resources outside of Kubernetes just like K8s native objects.

Once you are managing cloud infrastructure with CI/CD, the next step is to extend that same mechanism to manage objects within your databases such as tables, indexes, and views. To that extent we have released a Liquibase extension for Cloud Spanner.

Help you to move data with confidence

Cloud journeys often involve moving data either in a lift and shift process or sometimes replatforming to a different database. Whatever your journey, we want to simplify the process and give you the confidence that your migration is successful.

For enterprise users with Oracle databases, we have several open source projects. First, we have the Optimus Prime database assessment tool (repo) that queries your database and collects information about schemas and historic performance to be analyzed for migration complexity and consolidation potential. Our own professional services teams have been using this toolset to plan migrations to Bare Metal Solution for Oracle.

Some Oracle users are looking for opportunities to transform their workloads to fit with their bigger strategy of modernizing applications with Kubernetes. For this group we developed and open sourced the El Carro Kubernetes operator for Oracle. This not only automates database lifecycle tasks for systems running on Kubernetes, but also exposes declarative APIs for these operations.

If your application supports replatforming from Oracle to PostgreSQL, then we have a toolset for schema conversion along with dataflow pipelines that will read the output of a change data capture job and load it into a PostgreSQL database. What a great use-case for Datastream - our new serverless change data capture service.

Another case of heterogeneous database migration is to move MySQL or PostgreSQL databases to Cloud Spanner. HarbourBridge helps with the evaluation and data migration, and our latest contribution was adding support for DynamoDB as a source database. Part of every heterogeneous migration should be to validate that the source and target data are matching - we have released the Data Validation Toolkit for that use-case. DVT can connect to a number of source and target databases and compare the data on each side - giving you the confidence that your migration did not miss or change any records.

Conclusion

Whether you are migrating existing databases or you are building your next application in the cloud - we want to make your journey as comfortable and seamless as possible. Open source projects play a big role in meeting you where you are and providing you with the connectivity options, language support, and tools you want for management and migrations.

By Bjoern Rost, Product Manager, Google Cloud Databases

Using MicroK8s with Anthos Config Management in the world of IoT

Friday, December 11, 2020

When dealing with large scale Kubernetes deployments, managing configuration and policy is often very complicated. We discussed why Kubernetes’ declarative approach to configuration as data has become the most popular choice for most users a few weeks ago. Today, we will discuss bringing this approach to your MicroK8 deployments using Anthos Config Management.
Image of Anthos Config Management + Cloud Source Repositories + MicroK8s
Anthos Config Management helps you easily create declarative security and operational policies and implement them at scale for your Kubernetes deployments across hybrid and multi-cloud environments. At a high level, you represent the desired state of your deployment as code committed to a central Git repository. Anthos Config Management will ensure the desired state is achieved and also maintained across all your registered clusters.

You can use Anthos Config Management for both your Kubernetes Engine (GKE) clusters as well as on Anthos attached clusters. Anthos attached clusters is a deployment option that extends Anthos’ reach into Kubernetes clusters running in other clouds as well as edge devices and the world of IoT, the Internet of Things. In this blog you will learn by experimenting with attached clusters with MicroK8s, a conformant Kubernetes platform popular in IoT and edge environments.

Consider an organization with a large number of distributed manufacturing facilities or laboratories that use MicroK8s to provide services to IoT devices. In such a deployment, Anthos can help you manage remote clusters directly from the Anthos Console rather than investing engineering resources to build out a multitude of custom tools.

Consider the diagram below.

Diagram of Anthos Config Management with MicroK8s on the Factory Floor with IoT
This diagram shows a set of “N” factory locations each with a MicroK8s cluster supporting IoT devices such as lights, sensors, or even machines. You register each of the MicroK8s clusters in an Anthos environ: a logical collection of Kubernetes clusters. When you want to deploy the application code to the MicroK8s clusters, you commit the code to the repository and Anthos Config Management takes care of the deployment across all locations. In this blog we will show you how you can quickly try this out using a MicroK8s test deployment.

We will use the following Google Cloud services:
  • Compute Engine provides an Ubuntu instance for a single-node MicroK8s cluster. Ubuntu will use cloud-init to install MicroK8s and generate shell scripts and other files to save time.
  • Cloud Source Repositories will provide the Git-based repository to which we will commit our workload.
  • Anthos Config Management will perform the deployment from the repository to the MicroK8s cluster.

Let’s start with a picture

Here’s a diagram of how these components fit together.

Diagram of how Anthos Config Management works together with MicroK8s
  • A workstation instance is created from which Terraform is used to deploy four components: (1) an IAM service account, (2) a Google Compute Engine Instance with MicroK8s using permissions provided by the service account, (3) a Kubernetes configuration repo provided by Cloud Source Repositories, and (4) a public/private key pair.
  • The GCE instance will use the service account key to register the MicroK8s cluster with an Anthos environ.
  • The public key from the public/ private key pair will be registered to the repository while the private key will be registered with the MicroK8s cluster.
  • Anthos Config Management will be configured to point to the repository and branch to poll for updates.
  • When a Kubernetes YAML document is pushed to the appropriate branch of the repository, Anthos Config Management will use the private key to connect to the repository, detect that a commit has been made against the branch, fetch the files and apply the document to the MicroK8s cluster.
Anthos Config Management enables you to deploy code from a Git repository to Kubernetes clusters that have been registered with Anthos. Google Cloud officially supports GKE, AKS, and EKS clusters, but you can use other conformant clusters such as MicroK8s in accordance with your needs. The repository below shows you how to register a single MicroK8s cluster to receive deployments. You can also scale this to larger numbers of clusters all of which can receive updates from commitments to the repository. If your organization has large numbers of IoT devices supported by Kubernetes clusters you can update all of them from the Anthos console to provide for consistent deployments across the organization regardless of the locations of the clusters, including the IoT edge. If you would like to learn more, you can build this project yourself. Please check out this Git repository and learn firsthand about how Anthos can help you manage Kubernetes deployments in the world of IoT.

By Jeff Levine, Customer Engineer – Google Cloud

OpenTelemetry's First Release Candidates

Wednesday, October 21, 2020

OpenTelemetry has hit another milestone with the tracing specification reaching release candidate status.

With the specification now ready to go, expect to see tracing release candidates of the official APIs and SDKs over the next few weeks, along with updated exporters for Cloud Trace. In the coming months the same will follow for the metrics specification, followed by metrics release candidates of the APIs and SDKs and Cloud Monitoring exporters, followed by the project’s general availability. At this point we’ll switch our default application metrics and distributed tracing instrumentation from OpenCensus to OpenTelemetry.

This is exciting news for Google Cloud customers, as OpenTelemetry will enable even better observability experiences, both with Cloud Monitoring and Cloud Trace, or the third party monitoring and operations tools of your choice.

Originally posted on the on the OpenTelemetry blog.


Assess the security of Cloud deployments with InSpec for GCP

Thursday, August 20, 2020

InSpec-GCP version 1.0 is now generally available, and two new Chef InSpec™ profiles have been released under an open source software license. The InSpec profiles contain controls for the GCP Center for Internet Security (CIS) Benchmark version 1.1.0 and the Payment Card Industry Data Security Standard (PCI DSS) version 3.2.1.

The Cloud Security Challenge

Developers are embracing automated continuous integration and continuous delivery (CI/CD), committing many application and infrastructure changes frequently. But centralized security teams can't review every application and infrastructure change. Those teams might have to block deployments (which decreases velocity and undermines continuous delivery) or review changes in production, where misconfigurations are more harmful and changes are more expensive.

Security reviews need to "shift left,” earlier in the software development lifecycle. Security teams likewise need to shift their own efforts to defining policies and providing tools to automate how compliance is verified. When developers adopt these tools, security and compliance checks become part of CI/CD, in a similar fashion to unit, functional, and integration tests, and thus become a normal part of the development workflow. Empowering developers to participate in this process means organizations can achieve continuous compliance. This also reinforces the mindset that security is everyone's responsibility.

What is InSpec

InSpec is a popular DevSecOps framework that checks the configuration state of resources in virtual machines and containers, on cloud providers such as GCP, AWS, and Azure. InSpec's lightweight nature, approachable domain-specific language, and extensibility make it a valuable tool for:
  • Expressing compliance policies as code
  • Enabling development teams to add tests that assess their applications' compliance with security policies before pushing changes to build and release pipelines
  • Automating compliance verification in CI/CD pipelines and as part of the release process
  • Unifying compliance assessments across multiple cloud providers and on-premises environments

InSpec for GCP and compliance profiles

The InSpec GCP resource pack 1.0 provides a consistent way to audit GCP resources. This release unifies the user experience by adding consistent behavior between resources and documentation for available fields. This resource pack also adds support for GCP endpoints that let you audit fields that are in beta (for example, GKE cluster pod security policy configuration).

You can use the GCP CIS Benchmark and the PCI DSS InSpec profiles to assess compliance with CIS and PCI DSS policies. CIS Benchmarks are configuration guides used by governments, businesses, industry, and academia. We strongly recommend configuring the workloads to meet or exceed these standards. PCI DSS is required for all organizations that accept or process credit card payments. The Terraform PCI Starter, coupled with the PCI InSpec profile, allows deployment of PCI-compliant environments and verifies their ongoing compliance.

This work is released under an open source license and we look forward to your feedback and contributions.

Validating PCI DSS and CIS compliance in infrastructure build pipelines

You can use InSpec to validate infrastructure deployments for compliance with standards such as PCI DSS and CIS. An automated validation process of new builds is important to detect insecure and non-compliant configurations as early as possible while minimizing the impact on developer agility.

With Cloud Build you can create CI pipelines for infrastructure-as-code deployments. You can run InSpec as an additional build step against resources in the GCP project to detect compliance violations in the target infrastructure. While this method doesn't prevent non-compliant build configurations, it does detect compliance issues, fail the build execution, and log the error in Cloud Logging. Cloud Build publishes build messages to a Cloud Pub/Sub topic, which can trigger a Cloud Function to integrate with appropriate alerting systems in case of a failed build. To prevent non-compliant infrastructure in a production environment, run the pipeline in a staging environment before promoting the content to production.

Here is an example pipeline definition for Cloud Build, using InSpec, to validate a project against the PCI guidelines. To run the PCI profile from a container inside a Cloud Build pipeline, clone the Git repository Payment Card Industry Data Security Standard (PCI DSS) version 3.2.1, build the Docker container from the root directory of the repository using the Dockerfile, and push the image to the Google Container Registry. The Cloud Build pipeline will store InSpec reports in a predefined bucket in json and html formats.

Here's an example for executing the PCI DSS InSpec profile as a step in a Cloud Build pipeline:

#...Previous execution steps
#
- id: 'Run PCI Profile on in-scope project'
  waitFor: ['Write InSpec input file']
  name: gcr.io/${_GCR_PROJECT_ID}/inspec-gcp-pci-profile:v3.2.1-3
  entrypoint: '/bin/sh'
  args:
    - '-c'
    - |
      inspec exec /share/. -t gcp:// \
      --input-file /workspace/inputs.yml \
      --reporter cli json:/workspace/pci_report.json \
      html:/workspace/pci_report.html | tee out.json


Note that in this example a previous execution step writes all required input parameters into the file /workspace/inputs.yml to make them available to the InSpec run. A CI/CD pipeline has been implemented for the PCI-GKE-Blueprint using Cloud Build and can be referenced as an example.

Try it yourself

Ready to try InSpec? Use this Cloud Shell Walkthrough to quickly install InSpec in your Cloud Shell instance and scan infrastructure in your GCP projects against the CIS Benchmark:


Chances are that in the walkthrough the InSpec scan detected some misconfigurations in your project.

As a developer of the project, you now know how to quickly scan your deployments, and you can begin to learn more about configuring your resources securely. Our Cloud Foundation Toolkit provides Terraform and Deployment Manager templates for best-practice configurations of your projects and underlying resources.

Most large organizations have platform teams that can adopt our Cloud Foundation Toolkit templates, which automate well-configured resource provisioning, and make those available to their developers. These organizations can also include InSpec testing steps in their CI/CD pipelines to provide early feedback to developers and to prevent misconfigured resources from getting released to Production.

By Bakh Inamov – Security and Compliance Specialist Engineer, Sam Levenick – Software Engineer, and Konrad Schieban – Infrastructure Cloud Consultant

Cloud Spanner Emulator Reaches 1.0 Milestone!

Wednesday, August 19, 2020

The Cloud Spanner emulator provides application developers with the full set of APIs, including the full breadth of SQL and DDL features that can be run locally for prototyping, development and testing. This offline emulator is free and improves developer productivity for customers. Today, we are happy to announce that Cloud Spanner emulator is generally available (GA) with support for Partitioned APIs, Cloud Spanner client libraries, and SQL features.

Since Cloud Spanner emulator’s beta launch in April, 2020, we have seen strong adoption of the local emulator from customers of Cloud Spanner. Several new and existing customers adopted the emulator in their development & continuous test pipelines. They noticed significant improvements in developer productivity, speed of test execution, and error-free applications deployed to production. We also added several features in this release based on the valuable feedback we received from beta users. The full list of features is documented in the GitHub readme.

Partition APIs

When reading or querying large amounts of data from Cloud Spanner, it can be useful to divide the query into smaller pieces, or partitions, and use multiple machines to fetch the partitions in parallel. The emulator now supports Partition Read, Partition Query, and Partition DML APIs.

Cloud Spanner client libraries

With the GA launch, the latest versions of all the Cloud Spanner client libraries support the emulator. We have added support for C#, Node.js, PHP, Python, Ruby client libraries and the Cloud Spanner JDBC driver. This is in addition to C++, Go and Java client libraries that were already supported with the beta launch. Be sure to check out the minimum version for each of the client libraries that support the emulator.

Use the Getting Started guides to try the emulator with the client library of your choice.

SQL features

Emulator now supports the full set of SQL features provided by Cloud Spanner. Some of the notable additions being support for SQL functions JSON_VALUE, JSON_QUERY, CEILING, POWER, CHARACTER_LENGTH, and FORMAT. We now also support untyped parameter bindings in SQL statements which are used by our client libraries written in languages with dynamic typing e.g., Python, PHP, Node.js and Ruby.

Using Emulator in CI/CD pipelines

You may now point the majority of your existing CI/CD to the Cloud Spanner emulator instead of a real Cloud Spanner instance brought up on GCP. This will save you both cost and time, since an emulator instance comes up instantly and is free to use!

What’s even better is that you can bring up multiple instances in a single execution of the emulator, and of course multiple databases. Thus, tests that interact with a Cloud Spanner database can now run in parallel since each of them can have their own database, making tests hermetic. This can reduce flakiness in unit tests and reduce the number of bugs that can make their way to continuous integration tests or to production.

In case your existing CI/CD architecture assumes the existence of a Cloud Spanner test instance and/or test database against which the tests run, you can achieve similar functionality with the emulator as well. Note that the emulator doesn’t come up with a default instance or a default database as we expect users to create instances and databases as required in their tests for hermeticity as explained above. Below are two examples of how you can bring up an emulator with a default instance or database: 1) By using a docker image or 2) Programmatically.

Starting Emulator from Docker

The emulator can be started using Docker on Linux, MacOS, and Windows. As a prerequisite, you would need to install Docker on your system. To bring up an emulator with a default database/instance, you can execute a shell script in your docker file to do so. Such a script would make RPC calls to CreateInstance and CreateDatabase after bringing up the emulator server. You can also look at this example on how to put this together when using docker.

Run Emulator Programmatically

You can bring up the emulator binary in the same process as your test program. Then you can then create a default instance/database in your ‘Setup’ and clean up the same when the tests are over. Note that the exact procedure for bringing up an ‘in-process’ service may vary with the client library language and platform of your choice.

Other alternatives to start the emulator, including pre-built linux binaries, are listed here.
Try it now

Learn more about Google Cloud Spanner emulator and try it out now.

By Asheesh Agrawal, Google Open Source

Java zPages for OpenTelemetry

Friday, August 14, 2020

What is OpenTelemetry?

OpenTelemetry is an open source project aimed at improving the observability of our applications. It is a collection of cloud monitoring libraries and services for capturing distributed traces and metrics and integrates naturally with external observability tools, such as Prometheus and Zipkin. As of now, OpenTelemetry is in its beta stage and supports a few different languages.

What are zPages?

zPages are a set of dynamically generated HTML web pages that display trace and metrics data from the running application. The term zPages was coined at Google, where similar pages are used to view basic diagnostic data from a particular host or service. For our project, we built the Java /tracez and /traceconfigz zPages, which focus on collecting and displaying trace spans.

TraceZ

The /tracez zPage displays span data from the instrumented application. Spans are split into two groups: spans that are still running and spans that have completed.

TraceConfigZ

The /traceconfigz zPage displays the currently active tracing configuration and allows users to change the tracing parameters. Examples of such parameters include the sampling probability and the maximum number of attributes.

Using the zPages

This section describes how to start and use the Java zPages.

Add the dependencies to your project

First, you need to add OpenTelemetry as a dependency to your Java application.

Maven

For Maven, add the following to your pom.xml file:
<dependencies>
    <dependency>
        <groupId>io.opentelemetry</groupId>
        <artifactId>opentelemetry-api</artifactId>
        <version>0.7.0</version>
    </dependency>
    <dependency>
        <groupId>io.opentelemetry</groupId>
        <artifactId>opentelemetry-sdk</artifactId>
        <version>0.7.0</version>
    </dependency>
    <dependency>
        <groupId>io.opentelemetry</groupId>
        <artifactId>opentelemetry-sdk-extension-    zpages</artifactId>
        <version>0.7.0</version>
    </dependency>
</dependencies>

Gradle

For Gradle, add the following to your build.gradle dependencies:
implementation 'io.opentelemetry:opentelemetry-api:0.7.0'
implementation 'io.opentelemetry:opentelemetry-sdk:0.7.0'
implementation 'io.opentelemetry:opentelemetry-sdk-extension-zpages:0.7.0'

Register the zPages

To set-up the zPages, simply call startHttpServerAndRegisterAllPages(int port) from the ZPageServer class in your main function:
import io.opentelemetry.sdk.extensions.zpages.ZPageServer;

public class MyMainClass {
    public static void main(String[] args) throws Exception {
        ZPageServer.startHttpServerAndRegisterAllPages(8080);
        // ... do work
    }
}
Note that the package com.sun.net.httpserver is required to use the default zPages setup. Please make sure your version of the JDK includes this package if you plan to use the default server.

Alternatively, you can call registerAllPagesToHttpServer(HttpServer server) to register the zPages to a shared server:
import io.opentelemetry.sdk.extensions.zpages.ZPageServer;

public class MyMainClass {
    public static void main(String[] args) throws Exception {
        HttpServer server = HttpServer.create(new                     InetSocketAddress(8000), 10);
        ZPageServer.registerAllPagesToHttpServer(server);
        server.start();
        // ... do work
    }
}

Access the zPages

View all available zPages on the index page

The index page (at /) lists all available zPages with a link and description.


View trace spans on the /tracez zPage

The /tracez zPage displays information about running and completed spans, with completed spans further organized into latency and error buckets. The data is aggregated into a summary-level table:


You can click on each of the counts in the table cells to access the corresponding span details. For example, here are the details of the ChildSpan latency sample (row 1, col 4):


View and update the tracing configuration on the /traceconfigz zPage.

The /traceconfigz zPage provides an interface for users to modify the current tracing parameters:


Design

This section goes into the underlying design of our code.

Frontend


The frontend consists of two main parts: HttpHandler and HttpServer. The HttpHandler is responsible for rendering the HTML content, with each zPage implementing its own ZPageHandler. The HttpServer, on the other hand, is responsible for listening to incoming requests, obtaining the requested data, and then invoking the aforementioned ZPageHandlers. The HttpServer class from com.sun.net is used to construct the default server and to handle http requests on different routes.

Backend


The backend consists of two components as well: SpanProcessor and DataAggregator. The SpanProcessor watches the lifecycle of each span, invoking functions each time a span starts or ends. The DataAggregator, on the other hand, restructures the data from the SpanProcessor into an accessible format for the frontend to display. The class constructor requires a TracezSpanProcessor instance, so that the TracezDataAggregator class can access the spans collected by a specific TracezSpanProcessor. The frontend only needs to call functions in the DataAggregator to obtain information required for the web page.

Conclusion

We hope that this blog post has given you a little insight into the development and use cases of OpenTelemetry’s Java zPages. The zPages themselves are lightweight performance monitoring tools that allow users to troubleshoot and better understand their applications. Once OpenTelemetry is officially released, we hope that you try out and use the /tracez and /traceconfigz zPages!

By William Hu and Terry Wang – Software Engineering Interns, Core Compute Observability
.