opensource.google.com

Menu

Posts from 2016

Open source down under: Linux.conf.au 2017

Wednesday, December 28, 2016

It’s a new year and open source enthusiasts from around the globe are preparing to gather at the edge of the world for Linux.conf.au 2017. Among those preparing are Googlers, including some of us from the Open Source Programs Office.

This year Linux.conf.au is returning to Hobart, the riverside capital of Tasmania, home of Australia’s famous Tasmanian devils, running five days between January 16 and 20.
Circle_DevilTuz.png
Tuz, a Tasmanian devil sporting a penguin beak, is the Linux.conf.au mascot.
(Artwork by Tania Walker licensed under CC BY-SA.)
The conference, which began in 1999 and is community organized, is well equipped to explore the theme, "the Future of Open Source," which is reflected in the program schedule and miniconfs.

You’ll find Googlers speaking (listed below) as well as participating in the hallway track. Don’t miss our Birds of a Feather session if you’re a student, educator, project maintainer, or otherwise interested in talking about outreach and student programs like Google Summer of Code and Google Code-in.

Monday, January 16th
12:20pm The Sound of Silencing by Julien Goodwin
1:20pm   An Open Programming Environment Inspired by Programming Games by Josh Deprez

Tuesday, January 17th
All day    Community Leadership Summit X at LCA

Wednesday, January 18th
2:15pm   Community Building Beyond the Black Stump by Josh Simmons

Thursday, January 19th
4:35pm   Using Python for creating hardware to record FOSS conferences! by Tim Ansell

Friday, January 20th
1:20pm   Linux meets Kubernetes by Vishnu Kannan

Not able to make it to the conference? Keynotes and sessions will be livestreamed, and you can always find the session recordings online after the event.

We’ll see you there!

By Josh Simmons, Open Source Programs Office

Taking the pulse of Google Code-in 2016

Friday, December 23, 2016

GCI official horizontal_1372x448dp.png

Today is the official midpoint of this year’s Google Code-in contest and we are delighted to announce this is our most popular year ever! 930 teenagers from 60 countries have completed 3,503 tasks with 17 open source organizations. The number of students successfully completing tasks has almost met the total number of students from the 2015 contest already.

Tasks that the students have completed include:
  • writing test suites
  • improving mobile UI 
  • writing documentation and creating videos to help new users 
  • working on internationalization efforts
  • fixing and finding bugs in the organization's’ software 
Participants from all over the world
In total, over 2,800 students from 87 countries have registered for the contest and we look forward to seeing great work from these (and more!) students over the next few weeks. 2016 has also seen a huge increase in student participation in places such as Indonesia, Vietnam and the Philippines.

Google Code-in participants by country

Please welcome two new countries to the GCI family: Mauritius and Moldova! Mauritius made a very strong debut to the contest and currently has 13 registered students who have completed 31 tasks.

The top five countries with the most completed tasks are:
  1. India: 982
  2. United States: 801
  3. Singapore: 202
  4. Vietnam: 119
  5. Canada: 117
Students, there is still plenty of time to get started with Google Code-in. New tasks are being added daily to the contest site — there are over 1,500 tasks available for students to choose from right now! If you don’t see something that interests you today, check back again every couple of days for new tasks.

The last day to register for the contest and claim a task is Friday, January 13, 2017 with all work being due on Monday, January 16, 2017 at 9:00 am PT.

Good luck to all of the students participating this year in Google Code-in!

By Stephanie Taylor, Google Code-in Program Manager

All numbers reported as of 8:00 PM Pacific Time, December 22, 2016.

Google Summer of Code 2016 wrap-up: Public Lab

Wednesday, December 21, 2016

This post is part of our series of guest posts from students, mentors and organization administrators who participated in Google Summer of Code 2016.


How we made this our best Google Summer of Code ever

This was our fourth year doing Google Summer of Code (GSoC), and it was our best year ever by a wide margin! We had five hard-working students who contributed over 17,000 new lines of (very useful) code to our high-priority projects.

Students voluntarily started coding early and hit the ground running, with full development environments and a working knowledge of GitHub Flow-style pull request process. They communicated with one another and provided peer support. They wrote tests. Hundreds of them! They blogged about their work as they went, and chatted with other community members about how to design features.

All of that was amazing, and it was made better by the fact that we were accepting pull requests with new code twice weekly. Tuesdays and Fridays, I went through new submissions, provided feedback, and pulled new code into our master branch, usually publishing it to our production site once a week.

I don't know how other projects do things, but this was very new for us, and it's revolutionized how we work together. In past years, students would work on their forks, slowly building up features. Then in a mad dash at the end, we’d try to merge them into trunk, with lots of conflicts and many hours (weeks!) of work on the part of project maintainers.

Screenshot_2016-08-26_at_11.44.16_AM.png
What made this year so good?

Many things aligned to make this summer great, and basically none of them are our ideas. I'm sure plenty of you are cringing at how we used to do things, but I also don't think that it's that unusual for projects not "born" in the fast-paced world of modern code collaboration.

We used ideas and learned from Nicolas Bevacqua, author of JavaScript Application Design and of the woofmark and horsey libraries which I've contributed to. We've also learned a great deal from the Hoodie community, particularly Gregor Martynus, who we ran into at a BostonJS meetup. Lastly, we learned from SpinachCon, organized by Shauna Gordon McKeon and Deb Nicholson, where people refine their install process by actually going through the process while sitting next to each other.

Broadly, our strategies were:

  • Good documentation for newcomers (duh)
  • Short and sweet install process that you've tried yourself (thanks, SpinachCon!)
  • Predictable, regular merge schedule
  • Thorough test suite, and requiring tests with each pull request
  • Modularity, insisting that projects be broken into small, independently testable parts and merged as they’re written

Installation and pull requests

Most of the above sound kind of obvious or trivial, but we saw a lot of changes when we put it all together. Having a really fast install process, and guidance on getting it running in a completely consistent environment like the virtualized Cloud9 service, meant that many students were able to get the code running the same day they found the project. We aimed for an install time of 15 minutes max, and supplied a video of this for one of our codebases.

We also asked students to make a small change (even just add a space to a file) and walk through the GitHub Flow pull request (PR) submission process. We had clear step-by-step guidance for this, and we took it as a good sign when students were able to read through it and do this.

Importantly, we really tried to make each step welcoming, not demanding or dismissive, of folks who weren’t familiar with this process. This ultimately meant that all five students already knew the PR process when they began coding.

Twice-weekly merge schedule

We were concerned that, in past years, students only tried merging a few times and typically towards the end of the summer. This meant really big conflicts (with each other, often) and frustration.

This year we decided that, even though we’re a tiny organization with just one staff coder, we’d try merging on Tuesday and Friday mornings, and we mostly succeeded. Any code that wasn’t clearly presented, commits squashed, passing tests, and submitting new tests, was reviewed and I left friendly comments and requests so it could be merged the following week.

At first I felt bad rejecting PRs, but we had such great students that they got used to the strictness. They got really good at separating out features, demonstrating their features through clear tests, and some began submitting more than two PRs per week - always rebasing on top of the latest master to ensure a linear commit history. Sweet!

Wrap-up and next steps

The last thing we did was to ask each student, essentially as their documentation, to write a series of new issues which clearly described the problem and/or desired behavior, leave suggestions and links to specific lines of code or example code, and mark them with the special “help-wanted” tag which was so helpful to them when they first started out. We asked each to also make one extra-welcoming “first-timers-only” issue which walks a new contributor through every step of making a commit and even provides suggested code to be inserted.

This final requirement was key. While I personally made each of the initial set of “help-wanted” and “first-timers-only” issues before GSoC, now five students were offloading their unfinished to-dos as very readable and inviting issues for others. The effect was immediate, in part because these special tags are syndicated on some sites. Newcomers began picking them up within hours and our students were very helpful in guiding them through their first contributions to open source.

I want to thank everyone who made this past summer so great, from our champion mentors and community members, to our stellar students, to all our inspirations in this new process, to the dozen or so new contributors we’ve attracted since the end of August.

By Jeff Warren, Organization Administrator for PublicLab.org
Google Summer of Code 2016 wrap-up: CSE@TU Wien

Wednesday, December 14, 2016

Every year over a thousand university students work with more than a hundred open source organizations as part of the Google Summer of Code (GSoC). This post is part of a series of guest posts from students, mentors and organization administrators reflecting on GSoC 2016.

CSE@TU Wien is a loose interest group at the Technische Universität Wien (TU Wien) focused on developing, providing and utilizing free and open source software for research. We’re an umbrella organization for several open source projects and we participate in Google Summer of Code (GSoC) to ensure that future generations continue building open source software for scientific computing.

We’ve participated in GSoC most years since 2011, and in 2016 we had ten successful projects. The thematic areas are -- befitting an engineering-focused university -- very diverse. Let’s take a look at the projects and what students accomplished:

Carbon Footprint for Google Maps is a browser extension that calculates CO2 emissions that users would incur by driving on routes suggested by popular mapping services and displays this information alongside time and distance. The aim is to raise awareness of the environmental impact of driving cars.

Kolya Opahle brilliantly re-factored the extension, making it much more modular. This enabled expansion to include other map services and port to other browsers, with browser-specific implementations reduced to a minimum. Building for specific browsers was made easy through a Gradle build script. He took on the Firefox port himself, which turned out to be more challenging than expected due to incompatibilities between the extension API’s of Firefox and Chrome. Overcoming this challenge required ingenuity. 

Prateek Gupta completely re-designed and reimplemented the extension’s user interface, optimizing the storage of user options and allowing localization. He added support for more mapping services and calculations of additional greenhouse gases. He added new features to give the user more information about greenhouse gas emissions, including: 
  • a page with air quality index using an API from the World Air Quality Index
  • a page with tips to reduce emissions; a calculator to compute CO2 absorption by trees
  • another calculator for the benefits of walking and cycling instead of driving
Chirag Arora ported the extension to the Safari web browser. Like the port to Firefox, this proved challenging due to discrepancies between the Chrome and Safari extension API’s. Chirag also implemented several new features, including: 
  • more unit systems in the options page
  • automatic configuration of fuel price based on location and the Global Petrol Prices API
  • approximate calculation of CO2 emissions for public transportation
The Colibri project focuses on smart building energy management. Intelligent control strategies are becoming more and more important for efficiently operating residential and commercial buildings, as buildings are responsible for a significant amount of global energy consumption.

Georg Faustmann implemented a connector for Open Automated Demand Response (OpenADR) networks. OpenADR information and signals can now be processed and stored in the Colibri data store. One challenge for this student was comprehensive handling of the OpenADR specification. Based on the specification, Georg identified a set of relevant use cases which were finally realized in this Colibri component.

Josef Wechselauer worked on a connector for gateways based on the OASIS Open Building Information Exchange (OBIX) standard. This connector links physical devices and data from building automation systems to Colibri. Josef was very enthusiastic and he implemented the connector with an additional graphical user interface for browsing through available OBIX objects. The system test with real hardware was challenging, but he solved all of the problems.

Pratyush Talreja implemented a connector that enables the integration of MATLAB Simulink simulations. More precisely, the connector links to the MATLAB environment and can read and write data over interfaces provided by the simulation. Pratyush had some initial troubles with the system design and the role of the connector in the overall system. However, he tackled those challenges and succeeded in the end.

Mind the Word is a browser extension that helps users learn a new language. It randomly translates a few words per sentence on websites as the user browsers. Since the user sees the translated words in context, they can infer its meaning and thus gradually learns new vocabulary with minimal effort. The extension uses Google, Microsoft and Yandex translation APIs.

Ankit Muchhala re-factored and modernized the code base to ES6 using JSPM, fixing critical bugs in the process and setting up a test environment in Karma and Jasmine. After that, he redesigned the user interface, making extensive use of Bootstrap 3 along with AngularJS. He also implemented various features to make the extension more usable, such as: 
  • dispersed word translation
  • (automatic) blacklisting and easy whitelisting of words and websites
  • and the ability to backup and restore the user's configurations
Rohan Katyal ported the extension to Firefox and implemented several new features, including: 
  • speech of translated words
  • generation of quizzes with the translated words
  • search for visual hints, similar words and usage examples, and more. 
R/sdcMicro is the state-of-the-art R package for data anonymization and is used by national and international institutions. Data privacy has become a hot topic in research and requires serious effort to ensure that individuals cannot be identified.

Probhonjon Baruah improved the code quality of sdcMicro. He wrote unit tests that should help other contributors keep the package consistent and free of bugs. The main challenge for the student was understanding the object-oriented implementation of sdcMicro that goes beyond typical R packages. The student learned that standardized tests are too general to be useful, and that more problem-oriented and specific tests are more effective.

Classilist is an open source visualization dashboard for probabilistic classification data.

Medha Katehara of LNMIIT India developed Classilist, an interactive system for visualizing the performance of probabilistic classifiers. Additionally, she developed plugins to pull classification data from machine learning frameworks such as RapidMiner, WEKA and R.

In conclusion, we are -- again -- very happy with Google Summer of Code. Students advanced themselves and our research software, a clear win-win. Our large team of experienced mentors performed well and we’re grateful for their continued dedication and the support of our university. We hope to participate again in 2017!

By Josef Weinbub and Florian Rudolf, Organization Administrators for TU Wien, Austria

Open sourcing the Embedding Projector: a tool for visualizing high dimensional data

Monday, December 12, 2016

Originally posted on the Google Research Blog

Recent advances in machine learning (ML) have shown impressive results, with applications ranging from image recognition, language translation, medical diagnosis and more. With the widespread adoption of ML systems, it is increasingly important for research scientists to be able to explore how the data is being interpreted by the models. However, one of the main challenges in exploring this data is that it often has hundreds or even thousands of dimensions, requiring special tools to investigate the space.

To enable a more intuitive exploration process, we are open-sourcing the Embedding Projector, a web application for interactive visualization and analysis of high-dimensional data recently shown as an A.I. Experiment, as part of TensorFlow. We are also releasing a standalone version at projector.tensorflow.org, where users can visualize their high-dimensional data without the need to install and run TensorFlow.


Exploring Embeddings

The data needed to train machine learning systems comes in a form that computers don't immediately understand. To translate the things we understand naturally (e.g. words, sounds, or videos) to a form that the algorithms can process, we use embeddings, a mathematical vector representation that captures different facets (dimensions) of the data. For example, in this language embedding, similar words are mapped to points that are close to each other.

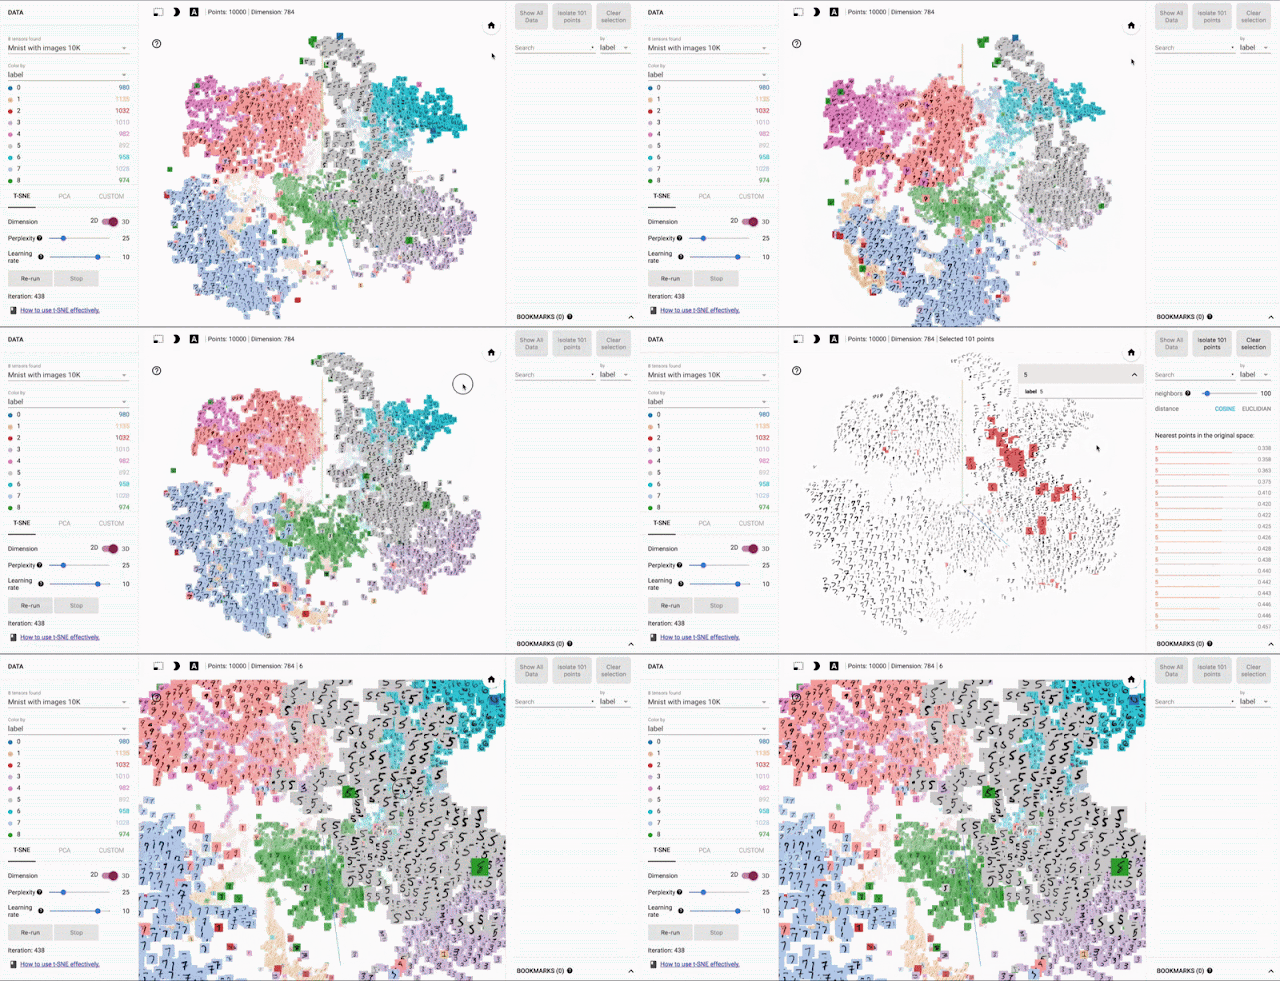
With the Embedding Projector, you can navigate through views of data in either a 2D or a 3D mode, zooming, rotating, and panning using natural click-and-drag gestures. Below is a figure showing the nearest points to the embedding for the word “important” after training a TensorFlow model using the word2vec tutorial. Clicking on any point (which represents the learned embedding for a given word) in this visualization, brings up a list of nearest points and distances, which shows which words the algorithm has learned to be semantically related. This type of interaction represents an important way in which one can explore how an algorithm is performing.


Methods of Dimensionality Reduction

The Embedding Projector offers three commonly used methods of data dimensionality reduction, which allow easier visualization of complex data: PCA, t-SNE and custom linear projections. PCA is often effective at exploring the internal structure of the embeddings, revealing the most influential dimensions in the data. t-SNE, on the other hand, is useful for exploring local neighborhoods and finding clusters, allowing developers to make sure that an embedding preserves the meaning in the data (e.g. in the MNIST dataset, seeing that the same digits are clustered together). Finally, custom linear projections can help discover meaningful "directions" in data sets - such as the distinction between a formal and casual tone in a language generation model - which would allow the design of more adaptable ML systems.

A custom linear projection of the 100 nearest points of "See attachments." onto the "yes" - "yeah" vector (“yes” is right, “yeah” is left) of a corpus of 35k frequently used phrases in emails
The Embedding Projector website includes a few datasets to play with. We’ve also made it easy for users to publish and share their embeddings with others (just click on the “Publish” button on the left pane). It is our hope that the Embedding Projector will be a useful tool to help the research community explore and refine their ML applications, as well as enable anyone to better understand how ML algorithms interpret data. If you'd like to get the full details on the Embedding Projector, you can read the paper here. Have fun exploring the world of embeddings!

By Daniel Smilkov and the Big Picture group

Google Summer of Code 2016 wrap-up: AOSSIE

Friday, December 9, 2016

We’re sharing guest posts from students, mentors and organization administrators who participated in Google Summer of Code (GSoC) 2016. This is the seventh post in the series.


AOSSIE (Australian Open Source Software Innovation and Education) is an organization created by the leaders of four research-oriented open source projects at the Australian National University. This was our first year in Google Summer of Code, but one of our projects had already participated three times as part of another organization.

We had 6 students and they surpassed our expectations. It was a great experience to mentor these students and provide them the opportunity to get involved in our cutting-edge research. We expect that their projects will lead to several publications and will be the starting point for long term collaborations.

Here are some highlights of their contributions:

Extempore is a programming language and runtime environment that supports live programming.

Joseph Penington adapted some cpp fluid dynamics code to show how live programming could be used to improve the workflow of scientific simulation. Joseph's project builds a series of increasingly complex fluid solvers in Extempore, allowing the programmer to make interesting and non-trivial changes to the simulation at runtime, including switching the way the fluids are solved in the middle of a simulation.

PriMedLink is software for matching similar patients in a way that preserves privacy (i.e. only using masked or encoded values of records without compromising privacy and confidentiality of patients) for health informatics applications such as clinical trials, advanced treatments and personalized patient care. The initial version of PPSPM software included masking and matching techniques for string, categorical and numerical (integer, floating point and modulus) data.

Mathu Mounasamy developed a module for PPSPM for masking and matching textual data which commonly occur in patient records (such as clinical notes and medical reports containing text data). The TextMM module developed by Mathu extends the functionality of PPSPM by allowing advanced privacy-preserving matching of similar patients based on various features containing textual data, thereby improving the quality and scope of PPSPM.

Rogas is a platform which integrates a collection of graph analysis tools and algorithms into a unified framework in order to support network analysis tasks.

Mojtaba Rezvani added the local community search (also known as local community detection) capability to Rogas. He has implemented several state-of-the-art algorithms proposed for local community detection, such as: k-core, k-truss, k-edge-connected, γ-quasi, and k-cliques. He has also designed a new algorithm for local community detection, which can efficiently identify local communities in large-scale networks.

Yan Xiao redesigned the GUI of Rogas in order to improve usability. He also implemented several visualization techniques to support the graph primitives of Rogas, including cluster, rank and path finding. These developments support dynamic network analysis at different scales so as to predict trends and patterns.

Skeptik is a Scala-based framework for proof theory and automated reasoning.

Ezequiel Postan generalized a challenging proof compression algorithm (the Split algorithm) from propositional logic to first-order logic and implemented it. This enables Skeptik to execute this algorithm not only on proofs output by SAT- and SMT-solvers but also on proofs output by resolution-based automated theorem provers. Ezequiel also implemented parsers for the TPTP and TSTP formats for theorem proving problems and proofs, and implemented a random proof generator to allow comprehensive experimental evaluation of the algorithms.

Daniyar Itegulov implemented a theorem prover for classical first-order logic using Skeptik's data structures and based on a novel logical calculus recently proposed by his mentor. This new calculus, called Conflict Resolution, is inspired by the propositional conflict-driven clause learning procedure used by SAT- and SMT-solvers and generalizes it to first-order logic. Daniyar also went further, conceiving and developing a concurrent proof search strategy for this calculus using Akka actors.

By Bruno Paleo, Organization Administrator for AOSSIE

Open-sourcing DeepMind Lab

Wednesday, December 7, 2016

Originally posted on DeepMind Blog

DeepMind's scientific mission is to push the boundaries of AI, developing systems that can learn to solve any complex problem without needing to be taught how. To achieve this, we work from the premise that AI needs to be general. Agents should operate across a wide range of tasks and be able to automatically adapt to changing circumstances. That is, they should not be pre-programmed, but rather, able to learn automatically from their raw inputs and reward signals from the environment. There are two parts to this research program: (1)  designing ever-more intelligent agents capable of more-and-more sophisticated cognitive skills, and (2) building increasingly complex environments where agents can be trained and evaluated.

The development of innovative agents goes hand in hand with the careful design and implementation of rationally selected, flexible and well-maintained environments. To that end, we at DeepMind have invested considerable effort toward building rich simulated environments to serve as  “laboratories” for AI research. Now we are open-sourcing our flagship platform,  DeepMind Lab, so the broader research community can make use of it.

DeepMind Lab is a fully 3D game-like platform tailored for agent-based AI research. It is observed from a first-person viewpoint, through the eyes of the simulated agent. Scenes are rendered with rich science fiction-style visuals. The available actions allow agents to look around and move in 3D. The agent’s “body” is a floating orb. It levitates and moves by activating thrusters opposite its desired direction of movement, and it has a camera that moves around the main sphere as a ball-in-socket joint tracking the rotational look actions. Example tasks include collecting fruit, navigating in mazes, traversing dangerous passages while avoiding falling off cliffs, bouncing through space using launch pads to move between platforms, playing laser tag, and quickly learning and remembering random procedurally generated environments. An illustration of how agents in DeepMind Lab perceive and interact with the world can be seen below:

At each moment in time, agents observe the world as an image, in pixels, rendered from their own first-person perspective. They also may receive a reward (or punishment!) signal. The agent can activate its thrusters to move in 3D and can also rotate its viewpoint along both horizontal and vertical axes.


Artificial general intelligence research in DeepMind Lab emphasizes navigation, memory, 3D vision from a first person viewpoint, motor control, planning, strategy, time, and fully autonomous agents that must learn for themselves what tasks to perform by exploring their environment. All these factors make learning difficult. Each are considered frontier research questions in their own right. Putting them all together in one platform, as we have, represents a significant new challenge for the field.


DeepMind Lab is highly customisable and extendable. New levels can be authored with off-the-shelf editor tools. In addition, DeepMind Lab includes an interface for programmatic level-creation. Levels can be customised with gameplay logic, item pickups, custom observations, level restarts, reward schemes, in-game messages and more. The interface can be used to create levels in which novel map layouts are generated on the fly while an agent trains. These features are useful in, for example, testing how an agent copes with unfamiliar environments. Users will be able to add custom levels to the platform via GitHub. The assets will be hosted on GitHub alongside all the code, maps and level scripts. Our hope is that the community will help us shape and develop the platform going forward.


DeepMind Lab has been used internally at DeepMind for some time (example). We believe it has already had a significant impact on our thinking concerning numerous aspects of intelligence, both natural and artificial. However, our efforts so far have only barely scratched the surface of what is possible in DeepMind Lab. There are opportunities for significant contributions still to be made in a number of mostly still untouched research domains now available through DeepMind Lab, such as navigation, memory and exploration.

As well as facilitating agent evaluation, there are compelling reasons to think that it may be fundamentally easier to develop intelligence in a 3D world, observed from a first-person viewpoint, like DeepMind Lab. After all, the only known examples of general-purpose intelligence in the natural world arose from a combination of evolution, development, and learning, grounded in physics and the sensory apparatus of animals. It is possible that a large fraction of animal and human intelligence is a direct consequence of the richness of our environment, and unlikely to arise without it. Consider the alternative: if you or I had grown up in a world that looked like Space Invaders or Pac-Man, it doesn’t seem likely we would have achieved much general intelligence!

Read the full paper here.

Access DeepMind's GitHub repository here.

By Charlie Beattie, Joel Leibo, Stig Petersen and Shane Legg, DeepMind Team


Why I contribute to Chromium

Monday, December 5, 2016

This is a guest post by Yoav Weiss who was recently recognized through the Google Open Source Peer Bonus Program for his work on the Chromium project. We invited Yoav to share about his work on our blog.

I was recently recognized by Google for my contributions to Chromium and wanted to write a few words on why I contribute to the project, other rendering engines and the web platform in general. I also wanted to share how it helped me evolve as a developer and why more people should contribute to the web platform for their own benefit.

The web platform

I’ve written before about why I think the web platform is an extremely important asset for humanity and why we should make sure it'll thrive for years to come. It enables the distribution of knowledge to the corners of the earth and has fundamentally changed our world. Yet, compared to the amount of users (billions!) and web developers (millions), there are only a few hundred engineers working on maintaining and improving the platform itself.

That means that there are many aspects of the platform that are not as well maintained as they should be. We're at a real risk of a "tragedy of the commons" scenario, where despite usage and utility, the platform will collapse under its own weight because maintaining it is nobody's exclusive problem.

How I got started

Personally, I had been working on web performance for well over a decade before I decided to get more involved and lend my hand in building the platform. For a large part of my professional life, browsers were black boxes. They were given to us by the browser gods and that's what we had to work with for the next few years. Their undocumented bugs and quirks became gospel, passed from senior engineers to their juniors.

Then at some point, that situation changed. Slowly but surely, open source browsers started picking up market share. No longer black boxes, we can actually see what happens on the inside!

I first got involved by joining the responsive images discussions and the Responsive Images Community Group. Then, I saw a tweet from RICG's chair calling to develop a prototype of the current proposal to prove its feasibility and value. And I jumped in.

I created a prototype using Chromium and WebKit, demoed it to anyone that was interested, worked on the proposals and argued the viability of the proposals' approach on the various mailing lists. Eventually, we were able to get some browser folks on board, improve the proposals and their fit to the rest of the platform, and I started working on an implementation.

The amount of work this required was larger than I expected. Eventually I managed to ship the feature in Blink and Chromium, and complete large parts of the implementation in WebKit as well. WOOT!

Success! Now what?

After that project was done, I started looking into what I should do next. I was determined to continue working on browsers and find a gig that would let me do that. So I searched for an employer with a vested interest in the web and in making it faster, who would be happy to let me work on the platform's client - the web browser.

I found such an employer in Akamai, where I have been working as a Principal Architect ever since. As part of my job I'm working on our performance optimization features as well as performance-related browser features, making sure they make it into browsers in a timely fashion.

Why you should contribute, too

Now, chances are that if you're reading this, you're also relying on the web platform for your job in one way or another. Which means that there's a chance that it also makes sense for your organization to contribute to the web platform. Let’s explore the reasons:

1. Make sure work is done on features you care about

If you're like me, you love the web platform and the reach it provides you, but you're not necessarily happy with all of it. The web is great, but not perfect. Since browsers and web standards are no longer black boxes, you can help change that.

You can work on standards and browsers to change them to include your use-case. That's immense power at your fingertips: put in the work and the platform evolves for all the billions of users out there.

And you don’t have to wait years before new features can be used in production like with yesteryear's browser changes. With today’s browser update rates and progressive enhancement, you’ll probably be able to use changes in production within a few months.

2. Gain expertise that can help you do your job better

Knowing browser internals better can also give you superpowers in other parts of your job. Whenever questions about browser behavior arrive, you can take a peek into the source code and have concrete answers rather than speculation.

Keeping track of standards discussions give you visibility into new browser APIs that are coming along, so that you can opt to use those rather than settle for sub-optimal alternatives that are currently available.

3. Grow as an engineer

Working on browsers teaches you a lot about how things work under the surface and enables you to understand the internals of modern browsers, which are extremely complex machines. Further, this work allows you to get code reviews from the world's leading experts on these subjects. What better way to grow than to interact with the experts?

4. It's a fun and welcoming community

Contributing to the web platform has been a great experience for me. Working with the Chromium project, in particular, is always great fun. The project is Google backed, but there are many external contributors and the majority of work and decisions are being done in the open. The people I've worked with are super friendly and happy to help. All in all, it's really fun!

Join us

The web needs more people working on it, and working on the web platform can be extremely beneficial to you, your career and your business.

If you're interested in getting started with web standards, the Discourse instance of the web Platform Incubator Community Group (or WICG for short) is where it's at (disclaimer: I'm co-chairing that group). For getting started with Chromium development, this is the post for you.

And most important, don't be afraid to ask the community. People on blink-dev and IRC are super friendly and will be happy to point you in the right direction.

So come on over and join the good cause. We'll be happy to have you!

By Yoav Weiss, Chromium contributor

Announcing OSS-Fuzz: Continuous fuzzing for open source software

Thursday, December 1, 2016

We are happy to announce OSS-Fuzz, a new Beta program developed over the past years with the Core Infrastructure Initiative community. This program will provide continuous fuzzing for select core open source software.

Open source software is the backbone of the many apps, sites, services, and networked things that make up “the internet.” It is important that the open source foundation be stable, secure, and reliable, as cracks and weaknesses impact all who build on it.

Recent security stories confirm that errors like buffer overflow and use-after-free can have serious, widespread consequences when they occur in critical open source software. These errors are not only serious, but notoriously difficult to find via routine code audits, even for experienced developers. That's where fuzz testing comes in. By generating random inputs to a given program, fuzzing triggers and helps uncover errors quickly and thoroughly.

In recent years, several efficient general purpose fuzzing engines have been implemented (e.g. AFL and libFuzzer), and we use them to fuzz various components of the Chrome browser. These fuzzers, when combined with Sanitizers, can help find security vulnerabilities (e.g. buffer overflows, use-after-free, bad casts, integer overflows, etc), stability bugs (e.g. null dereferences, memory leaks, out-of-memory, assertion failures, etc) and sometimes even logical bugs.

OSS-Fuzz’s goal is to make common software infrastructure more secure and stable by combining modern fuzzing techniques with scalable distributed execution. OSS-Fuzz combines various fuzzing engines (initially, libFuzzer) with Sanitizers (initially, AddressSanitizer) and provides a massive distributed execution environment powered by ClusterFuzz.

Early successes

Our initial trials with OSS-Fuzz have had good results. An example is the FreeType library, which is used on over a billion devices to display text (and which might even be rendering the characters you are reading now). It is important for FreeType to be stable and secure in an age when fonts are loaded over the Internet. Werner Lemberg, one of the FreeType developers, was an early adopter of OSS-Fuzz. Recently the FreeType fuzzer found a new heap buffer overflow only a few hours after the source change:

ERROR: AddressSanitizer: heap-buffer-overflow on address 0x615000000ffa
READ of size 2 at 0x615000000ffa thread T0
SCARINESS: 24 (2-byte-read-heap-buffer-overflow-far-from-bounds)
   #0 0x885e06 in tt_face_vary_cvtsrc/truetype/ttgxvar.c:1556:31

OSS-Fuzz automatically notified the maintainer, who fixed the bug; then OSS-Fuzz automatically confirmed the fix. All in one day! You can see the full list of fixed and disclosed bugs found by OSS-Fuzz so far.

Contributions and feedback are welcome

OSS-Fuzz has already found 150 bugs in several widely used open source projects (and churns ~4 trillion test cases a week). With your help, we can make fuzzing a standard part of open source development, and work with the broader community of developers and security testers to ensure that bugs in critical open source applications, libraries, and APIs are discovered and fixed. We believe that this approach to automated security testing will result in real improvements to the security and stability of open source software.

OSS-Fuzz is launching in Beta right now, and will be accepting suggestions for candidate open source projects. In order for a project to be accepted to OSS-Fuzz, it needs to have a large user base and/or be critical to Global IT infrastructure, a general heuristic that we are intentionally leaving open to interpretation at this early stage. See more details and instructions on how to apply here.

Once a project is signed up for OSS-Fuzz, it is automatically subject to the 90-day disclosure deadline for newly reported bugs in our tracker (see details here). This matches industry’s best practices and improves end-user security and stability by getting patches to users faster.

Help us ensure this program is truly serving the open source community and the internet which relies on this critical software, contribute and leave your feedback on GitHub.

By Mike Aizatsky, Kostya Serebryany (Software Engineers, Dynamic Tools); Oliver Chang, Abhishek Arya (Security Engineers, Google Chrome); and Meredith Whittaker (Open Research Lead).

Docker + Dataflow = happier workflows

Wednesday, November 30, 2016

When I first saw the Google Cloud Dataflow monitoring UI -- with its visual flow execution graph that updates as your job runs, and convenient links to the log messages -- the idea came to me. What if I could take that UI, and use it for something it was never built for? Could it be connected with open source projects aimed at promoting reproducible scientific analysis, like Common Workflow Language (CWL) or Workflow Definition Language (WDL)?
Screenshot of a Dockerflow workflow for DNA sequence analysis.

In scientific computing, it’s really common to submit jobs to a local high-performance computing (HPC) cluster. There are tools to do that in the cloud, like Elasticluster and Starcluster. They replicate the local way of doing things, which means they require a bunch of infrastructure setup and management that the university IT department would otherwise do. Even after you’re set up, you still have to ssh into the cluster to do anything. And then there are a million different choices for workflow managers, each unsatisfactory in its own special way.

By day, I’m a product manager. I hadn’t done any serious coding in a few years. But I figured it shouldn’t be that hard to create a proof-of-concept, just to show that the Apache Beam API that Dataflow implements can be used for running scientific workflows. Now, Dataflow was created for a different purpose, namely, to support scalable data-parallel processing, like transforming giant data sets, or computing summary statistics, or indexing web pages. To use Dataflow for scientific workflows would require wrapping up shell steps that launch VMs, run some code, and shuttle data back and forth from an object store. It should be easy, right?

It wasn’t so bad. Over the weekend, I downloaded the Dataflow SDK, ran the wordcount examples, and started modifying. I had a “Hello, world” proof-of-concept in a day.

To really run scientific workflows would require more, of course. Varying VM shapes, a way to pass parameters from one step to the next, graph definition, scattering and gathering, retries. So I shifted into prototyping mode.

I created a new GitHub project called Dockerflow. With Dockerflow, workflows can be defined in YAML files. They can also be written in pretty compact Java code. You can run a batch of workflows at once by providing a CSV file with one row per workflow to define the parameters.

Dataflow and Docker complement each other nicely:

  • Dataflow provides a fully managed service with a nice monitoring interface, retries,  graph optimization and other niceties.
  • Docker provides portability of the tools themselves, and there's a large library of packaged tools already available as Docker images.

While Dockerflow supports a simple YAML workflow definition, a similar approach could be taken to implement a runner for one of the open standards like CWL or WDL.

To get a sense of working with Dockerflow, here’s “Hello, World” written in YAML:

defn:
  name: HelloWorkflow
steps:
- defn:
    name: Hello
    inputParameters:
      name: message
      defaultValue: Hello, World!
    docker:
      imageName: ubuntu
      cmd: echo $message

And here’s the same example written in Java:

public class HelloWorkflow implements WorkflowDefn {
  @Override
  public Workflow createWorkflow(String[] args) throws IOException {
    Task hello =
        TaskBuilder.named("Hello").input("message", “Hello, World!”).docker(“ubuntu”).script("echo $message").build();
    return TaskBuilder.named("HelloWorkflow").steps(hello).args(args).build();
  }
}

Dockerflow is just a prototype at this stage, though it can run real workflows and includes many nice features, like dry runs, resuming failed runs from mid-workflow, and, of course, the nice UI. It uses Cloud Dataflow in a way that was never intended -- to run scientific batch workflows rather than large-scale data-parallel workloads. I wish I’d written it in Python rather than Java. The Dataflow Python SDK wasn’t quite as mature when I started.

Which is all to say, it’s been a great 20% project, and the future really depends on whether it solves a problem people have, and if others are interested in improving on it. We welcome your contributions and comments! How do you run and monitor scientific workflows today?

By Jonathan Bingham, Google Genomics and Verily Life Sciences

Google Summer of Code 2016 wrap-up: STE||AR

Tuesday, November 29, 2016

This is part of a series of guest posts from students, mentors and organization administrators who participated in Google Summer of Code (GSoC) 2016. GSoC is an annual program which pairs university students with mentors to work on open source software.


This summer the STE||AR Group was proud to mentor four students through Google Summer of Code. These students worked on a variety of projects which helped improve our software, HPX. This library is a distributed C++ runtime system which supports a standards compliant API and helps users scale their applications across thousands of machines.

The improvements to the code base will help our team and users of HPX around the world. A summary of our students’ projects:

Parsa Amini – HPX Debugger

Developing a better distributed debugging tool is essential to increase the programmability of HPX. Parsa’s project, Scimitar, aims to facilitate the debugging process for HPX programmers by extending the features of GDB, an existing debugger. The project then complements it with new commands for easier switching between localities across clusters, HPX thread debugging, awareness of internal HPX data structures, and semi-automated preparation for distributed debugging sessions. Additional functionality such as locating an object and viewing the queue information on each core is provided through using API provided by HPX itself. His work can be found on GitHub.

Aalekh Nigam – Implement a Map/Reduce Framework

This project aimed to expose a Map/Reduce programming model over HPX. During the summer, Aalekh was able to develop a single node implementation of HPXflow (map/reduce programming model) and laid the groundwork for the further multi-node version with database support. Although the initial task was limited to implementing the Map/Reduce model, he was also able to implement an improved dataflow model as well.

Minh-Khanh Do - Working on Parallel Algorithms for HPX::Vector

Minh-Khanh’s task was to take the parallel algorithms and add the functionality required to work on the segmented hpx::vector. Under his mentor John Biddscombe, he implemented the segmented_fill algorithm, which was successfully merged into the main codebase. Additionally, Minh-Khanh implemented the segmented_scan algorithm which includes inclusive and exclusive_scan. These changes are included in a pull request and have been merged. Using the segmented scan algorithm it is possible to perform tasks such as evaluating polynomials and to implement other algorithms such as quicksort.

Satyaki Upadhyay - Plugin Mechanism for thread schedulers in HPX

In HPX, schedulers are statically linked and must be built at compile-time. Satyaki’s project involved converting this statically linked scheme into a plugin system which would allow arbitrary schedulers to be dynamically loaded. These changes bring several benefits. They provide a layer of abstraction and follow the open/closed principle of software design as well as allowing developers to write their own custom schedulers while conforming to a uniform API. The project proceeded in two steps. The first involved the creation of plugin modules of the schedulers and registering them with HPX. The second step was to implement the loading and subsequent use of the chosen scheduler.

We would like to thank our students and mentors for the time that they have contributed to HPX this summer. In addition, we would like to thank Google for the opportunity that they provided the STE||AR Group to work with developers around the globe as well as the ability for students to interact with vibrant open source projects worldwide.

By Adrian Serio, Organization Administrator for The STE||AR Group

It’s that time again: Google Code-in starts today!

Monday, November 28, 2016

Today marks the start of the 7th year of Google Code-in (GCI), our pre-university contest introducing students to open source development. GCI takes place entirely online and is open to students between the ages of 13 and 17 around the globe.
The concept is simple: complete bite-sized tasks (at your own pace) created by 17 participating open source organizations on topic areas you find interesting:

  • Coding
  • Documentation/Training
  • Outreach/Research
  • Quality Assurance
  • User Interface

Tasks take an average of 3-5 hours to complete and include the guidance of a mentor to help along the way. Complete one task? Get a digital certificate. Three tasks? Get a sweet Google t-shirt. Finalists get a hoodie. Grand Prize winners get a trip to Google headquarters in California.

Over the last 6 years, 3213 students from 99 countries have successfully completed tasks in GCI. Intrigued? Learn more about GCI by checking out our rules and FAQs. And please visit our contest site and read the Getting Started Guide.

Teachers, if you are interested in getting your students involved in Google Code-in you can find resources here to help you get started.

By Mary Radomile, Open Source Programs Office

Stories from Google Code-in: Sugar Labs and Systers

Wednesday, November 23, 2016

Google Code-in (GCI) is our annual contest that gives students age 13 to 17 experience in computer science through contributions to open source projects. This blog post is the final installment in our series reflecting on the experiences of Google Code-in 2015 grand prize winners. Be sure to check out the first three posts.

The Google Code-in contest begins on Monday, November 28th at 9am PT for students. Right now you can learn more about the 17 mentoring organizations that students will be able to work with by going to the contest site. To get students excited for GCI 2016, we’re sharing three more stories from GCI 2015 grand prize winners. These stories illustrate how global the competition is, the challenges students face and the valuable skills they learn working with these open source organizations.

IMG_20160614_152138.jpg
A group of Google Code-in 2015 mentors joined grand prize winners for a day of exploring
San Francisco including the iconic Golden Gate Bridge.
First up is the story of Ezequiel Pereira, a student from Uruguay who worked with Sugar Labs. Sugar Labs is the organization behind Sugar, the operating system for the OLPC XO-1 which the Uruguayan government has distributed to public primary schools. The XO-1 was Ezequiel’s first computer.

Ezequiel’s curiosity in computer science was piqued when a technician came to his school to solve a simple bug that was affecting most XO’s. The technician used the command line which, up to that point, Ezequiel thought was useless. Realizing that the command line offered him a lot of power, Ezequiel began his exploration.

He discovered Google Code-in by reading about another Uruguayan teenager, one who was a grand prize winner in Google Code-in 2012. Ezequiel jumped into the contest and participated for several years expanding his skills before finishing as a grand prize winner of Google Code-in 2015. Along the way Ezequiel got comfortable with IRC and began helping other students, even finding new friends among along the way.


Next we have Sara Du from the United States. Sara had been coding for six months when she discovered Google Code-in on Christmas Eve, halfway through the competition. She found lots of interesting tasks, but had trouble finding the right organization to focus on before selecting Systers.

Like many students, Sara was able to quickly jump into code but spent a couple days just getting acquainted with Git and GitHub. This is something we hear from a lot of students and it’s just one of the skills that they pick up by working on real-world projects, along with testing and communication.

Another challenge Sara faced was working with a mentor 16 time zones away from her, which meant that correspondence would often take a day or two. While this was a challenge, she found the long feedback loop encouraged her to get on the Slack channel and reach out to other contributors for help. Ultimately, this made her even more a part of the Systers community.

Sara said Google Code-in was one of the most awesome experiences she’s had and has this advice to offer future participants: “The organization you end up working with has a vibrant community of hackers from everywhere; try to interact with them and you will be sure to learn from others as they will from you!”


Last, but certainly not least, we have Ahmed Sabie, a student from Canada who also worked with Systers. Ahmed started coding competitively several years ago, focusing on graph theory, dynamic programming and data structures. He loved the problem solving, but knew that these competitions took place in a sandbox. To grow, Ahmed would need to explore.

Enter Google Code-in. Ahmed was most comfortable with Python and saw that the Systers Volunteer Management System used that language, so that’s where he started.

Ahmed, like many students and even professional developers, spent much of his first week setting up his development environment. It was a grueling process but with the help of search and the people in the Systers Slack channel he was finally able to see the project’s login screen.

As he completed easy tasks, Ahmed moved on to more difficult tasks and began to help other students, many who got stuck on the same issues he had encountered earlier. Ahmed found that each task provided an opportunity to stretch his skills a little bit more. He was excited about how quickly he was learning. Though Ahmed learned a lot on his own, he says the vast majority of what he learned was through the help of other people -- students, mentors and other project contributors -- and that he felt like he was truly a part of the Systers community by the end of the process. 

Ahmed’s favorite task was an appropriate finale for the competition: he added multilingual support to an application he had worked on and added the French translation.
“Overall, Google Code-in was the experience of a lifetime. It set me up for the future, by teaching me relevant and critical skills necessary in software development. I have contributed to a good cause, and met fantastic mentors and friends along the way. Open source development is not a onetime thing, it is an ongoing process. I hope to continue to be part of it, and to me it is a form of volunteering and giving back to the community.” - Ahmed Sabie

With that, we conclude our series of posts reflecting on Google Code-in 2015. We thank Ezequiel, Sara, Ahmed and all the other participants for sharing their stories and contributing to the software we all rely on. We hope you will join us in carrying on the tradition with Google Code-in 2016!

By Josh Simmons, Open Source Programs Office

Google Summer of Code 2016 wrap-up: Linux XIA

Friday, November 18, 2016

We're sharing guest posts from students, mentors and organization administrators who participated in Google Summer of Code 2016. This is the fifth post in that series and there are more on the way.


Linux XIA is the native implementation of XIA, a meta network architecture that supports evolution of all of its components, which we call “principals,” and promotes interoperability between these principals. It is the second year that our organization, Boston University / XIA, has participated in Google Summer of Code (GSoC), and this year we received 31 proposals from 8 countries.

Our ideas list this year focused on upgrading key forwarding data structures to their best known versions. Our group chose the most deserving students for each of the following projects:

Accelerating the forwarding speed of the LPM principal with poptrie

Student André Ferreira Eleuterio and mentor Cody Doucette implemented the first version of the LPM principal in Linux XIA for GSoC 2015. The LPM principal enables Linux XIA to leverage routing tables derived from BGP, OSPF, IS-IS and any other IP routing protocol to forward XIA packets natively, that is, without encapsulation in IP. For GSoC 2016, student Vaibhav Raj Gupta from India partnered with mentor Cody Doucette to speed up the LPM principal by employing a state-of-the-art data structure to find the longest prefix matching using general purpose processors: poptrie.

Upgrading the FIB hash table of principals to the relativistic hash table

Principals that rely on routing flat names have used a resizable hash table that supports lockless readers since 2011. While this data structure was unique in 2011, in the same year, relativistic hash tables were published. The appeal to upgrade to relativistic hash tables was twofold: reduced memory footprint per hashed element, and the fact they were implemented in the Linux kernel in 2014. Student Sachin Paryani, also from India, worked with mentor Qiaobin Fu to replace our resizable hash table with the relativistic hash table.

Google Summer of Code nurtures a brighter future. Thanks to GSoC, our project has received important code contributions, and our community has been enlarged. It was rewarding to learn that two of our GSoC students have decided to pursue graduate school after their GSoC experience with us: Pranav Goswami (2015) and Sachin Paryani (2016). We hope these examples will motivate other students to do their best because the world is what we make of it.

By Michel Machado, Boston University / XIA organization administrator

Google Summer of Code 2016 wrap-up: Debian

Wednesday, November 16, 2016

This is the fourth post in our series of wrap-ups and guest posts from participants reflecting on Google Summer of Code (GSoC) 2016. Explore the first three posts and stay tuned for more wrap-ups and announcements.


Debian, founded in 1993, is a project aimed at building a 100% free and open source “Universal Operating System.” It’s a volunteer-driven project based on Linux, FreeBSD
and Hurd kernels for devices ranging from mobile phones to large clusters.

Being a wide umbrella project, Debian offered a diverse array of opportunities for Google Summer of Code (GSoC) students. For example, students worked on making our distribution more trustworthy (reproducible builds), porting our OS to Android devices and improving infrastructure for developers. This year I joined the Debian Real-Time Communications (RTC) mentoring team which engaged 13 students to improve voice, video and chat communication with free software.

WebRTC, an open standard enabling real-time video and audio communication in the browser, is central to this work. It was used to create JSCommunicator, an embeddable WebRTC phone developed in HTML, CSS and JavaScript, supporting voice, video and chat using SIP over WebSockets. A GSoC 2014 student, Juliana Louback, significantly enhanced JSCommunicator during her summer with Debian.

JSCommunicator is now being adapted for use with content management systems (CMS) and blogging platforms, making it easy to embed rich communication features in existing systems. It was this work that our current GSoC students built on.

This year I mentored GSoC student Mesut Can Gurle who used DruCall, a Drupal module for integrating JSCommunicator, as inspiration for building WPCall for WordPress. With this new plug-in, standards-based voice, video and chat is now available on the world’s two most popular CMS without the need for browser plugins.

The way WPCall was extrapolated from the DruCall plugin provides a pattern that other communities can follow to rapidly create WebRTC plugins for their own web frameworks. The JSCommunicator Integration Guide provides step-by-step instructions that developers and future students can follow. If you’re interested in learning more about significant developments in this space, please subscribe to the Free-RTC Announce mailing list and follow planet.freertc.org.

This was my first year as a GSoC mentor and I had such a great experience. It was rewarding working with Mesut on achieving his goals and we learned a lot along the way. Despite some setbacks (he narrowly missed a bombing as his country experienced an attempted coup), Mesut has made valuable contributions to free software.

As the summer wound down, I received an invitation to participate in a t-shirt design contest for the annual Mentor Summit. I thought it would be fun to try and put together a design focusing on GSoC’s key values.

The front of the t-shirt shows developers from all over the world collaborating on free software, representing the amazing scope and diversity of the projects. On the back, above the clouds, a space shuttle symbolizes what’s achieved through GSoC.

A group of attendees wearing the Google Summer of Code 2016 Mentor Summit t-shirt.

Happily, my design was selected and it was great seeing all the attendees wearing it at the Mentor Summit!

By Bruno Magalhães, Mentor for Debian

ETC2Comp: fast texture compression for games and VR

Monday, November 14, 2016

For mobile game and VR developers the ETC2 texture format has become an increasingly valuable tool for texture compression. It produces good on-GPU sizes (it stays compressed in memory) and higher quality textures (compared to its ETC1 counterpart).

These benefits come with a significant downside, however: ETC2 textures take significantly longer to compress than their ETC1 counterparts. As adoption of the ETC2 format increases in a project, so do build times. As such, developers have had to make the classic choice between quality and time.

We wanted to eliminate the need for developers to make that choice, so we’ve released ETC2Comp, a fast and high quality ETC2 encoder for games and VR developers.

ETC2 takes a long time to compress textures because the format defines a large number of possible combinations for encoding a block in the texture. To find the most perfect, highest quality compressed image means brute-forcing this incredibly large number of combinations, which clearly is not a time efficient option.

We designed ETC2Comp to get the same visual results at much faster speeds by deploying a few optimization techniques:

Directed Block Search. Rather than a brute-force search, ETC2Comp uses a much more limited, targeted search for the best encoding for a given block. ETC2Comp comes with a precomputed set of archetype blocks, where each archetype is associated with a sorted list of the ETC2 block format types that provide its best encodings. During the actual compression of a texture, each block is initially assigned an archetype, and multiple passes are done to test the block against its block format list to find the best encoding. As a result, the best option can be found much quicker than with a brute-force method.

Full effort setting. During each pass of the encoding process, all the blocks of the image are sorted by their visual quality (worst-looking to best-looking). ETC2Comp takes an effort parameter whose value specifies what percentage of the blocks to update during each pass of encoding. An effort value of 25, for instance, means that on each pass, only the 25% worst looking blocks are tested against the next format in their archetypes' format-chains. The result is a tradeoff between optimizing blocks that already look good, and the time it takes to do it.

Highly multi-threaded code. Since blocks can be evaluated independently during each pass, it’s straightforward to apply multithreading to the work. During encoding ETC2comp can take advantage of available parallel threads, and it even accepts a jobs parameter, where you can define exactly the number of threads you’d like it to use... in case you have a 256 core machine.

Check out the code on GitHub to get started with ETC2Comp and let us know what you think. You can use the tool from the command line or embed the C++ library in your project. If you want to know more about what’s going on under the hood, check out this blog post.

By Colt McAnlis, Developer Advocate

Open source visualization of GPS displacements for earthquake cycle physics

Thursday, November 10, 2016

The Earth’s surface is moving, ever so slightly, all the time. This slow, small, but persistent movement of the Earth's crust is responsible for the formation of mountain ranges, sudden earthquakes, and even the positions of the continents. Scientists around the world measure these almost imperceptible movements using arrays of Global Navigation Satellite System (GNSS) receivers to better understand all phases of an earthquake cycle—both how the surface responds after an earthquake, and the storage of strain energy between earthquakes.

To help researchers explore this data and better understand the Earthquake cycle, we are releasing a new, interactive data visualization which draws geodetic velocity lines on top of a relief map by amplifying position estimates relative to their true positions. Unlike existing approaches, which focus on small time slices or individual stations, our visualization can show all the data for a whole array of stations at once. Open sourced under an Apache 2 license, and available on GitHub, this visualization technique is a collaboration between Harvard’s Department of Earth and Planetary Sciences and Google's Machine Perception and Big Picture teams.

Our approach helps scientists quickly assess deformations across all phases of the earthquake cycle—both during earthquakes (coseismic) and the time between (interseismic). For example, we can see azimuth (direction) reversals of stations as they relate to topographic structures and active faults. Digging into these movements will help scientists vet their models and their data, both of which are crucial for developing accurate computer representations that may help predict future earthquakes.

Classical approaches to visualizing these data have fallen into two general categories: 1) a map view of velocity/displacement vectors over a fixed time interval and 2) time versus position plots of each GNSS component (longitude, latitude and altitude).

Examples of classical approaches. On the left is a map view showing average velocity vectors over the period from 1997 to 2001[1]. On the right you can see a time versus eastward (longitudinal) position plot for a single station.

Each of these approaches have proved to be informative ways to understand the spatial distribution of crustal movements and the time evolution of solid earth deformation. However, because geodetic shifts happen in almost imperceptible distances (mm) and over long timescales, both approaches can only show a small subset of the data at any time—a condensed average velocity per station, or a detailed view of a single station, respectively. Our visualization enables a scientist to see all the data at once, then interactively drill down to a specific subset of interest.

Our visualization approach is straightforward; by magnifying the daily longitude and latitude position changes, we show tracks of the evolution of the position of each station. These magnified position tracks are shown as trails on top of a shaded relief topography to provide a sense of position evolution in geographic context.

To see how it works in practice, let’s step through an an example. Consider this tiny set of longitude/latitude pairs for a single GNSS station, with the differing digits shown in bold:


Day IndexLongitudeLatitude
0139.0699040734.949757897
1139.0699040034.949757882
2139.0699041334.949757941
3139.0699040934.949757921
4139.0699041334.949757904

If we were to draw line segments between these points directly on a map, they’d be much too small to see at any reasonable scale. So we take these minute differences and multiply them by a user-controlled scaling factor. By default this factor is 105.5 (about 316,000x).


To help the user identify which end is the start of the line, we give the start and end points different colors and interpolate between them. Blue and red are the default colors, but they’re user-configurable. Although day-to-day movement of stations may seem erratic, by using this method, one can make out a general trend in the relative motion of a station.
Close-up of a single station’s movement during the three year period from 2003 to 2006.
However, static renderings of this sort suffer from the same problem that velocity vector images do; in regions with a high density of GNSS stations, tracks overlap significantly with one another, obscuring details. To solve this problem, our visualization lets the user interactively control the time range of interest, the amount of amplification and other settings. In addition, by animating the lines from start to finish, the user gets a real sense of motion that’s difficult to achieve in a static image.

We’ve applied our new visualization to the ~20 years of data from the GEONET array in Japan. Through it, we can see small but coherent changes in direction before and after the great 2011 Tohoku earthquake.
GPS data sets (in .json format) for both the GEONET data in Japan and the Plate Boundary Observatory (PBO) data in the western US are available at earthquake.rc.fas.harvard.edu.
This short animation shows many of the visualization’s interactive features. In order:
  1. Modifying the multiplier adjusts how significantly the movements are magnified.
  2. We can adjust the time slider nubs to select a particular time range of interest.
  3. Using the map controls provided by the Google Maps JavaScript API, we can zoom into a tiny region of the map.
  4. By enabling map markers, we can see information about individual GNSS stations.
By focusing on a stations of interest, we can even see curvature changes in the time periods before and after the event.
Station designated 960601 of Japan’s GEONET array is located on the island of Mikura-jima. Here we see the period from 2006 to 2012, with movement magnified 105.1 times (126,000x).
To achieve fast rendering of the line segments, we created a custom overlay using THREE.js to render the lines in WebGL. Data for the GNSS stations is passed to the GPU in a data texture, which allows our vertex shader to position each point on-screen dynamically based on user settings and animation.

We’re excited to continue this productive collaboration between Harvard and Google as we explore opportunities for groundbreaking, new earthquake visualizations. If you’d like to try out the visualization yourself, follow the instructions at earthquake.rc.fas.harvard.edu. It will walk you through the setup steps, including how to download the available data sets. If you’d like to report issues, great! Please submit them through the GitHub project page.

Acknowledgments

We wish to thank Bill Freeman, a researcher on Machine Perception, who hatched the idea and developed the initial prototypes, and Fernanda Viégas and Martin Wattenberg of the Big Picture Team for their visualization design guidance.

References

[1] Loveless, J. P., and Meade, B. J. (2010). Geodetic imaging of plate motions, slip rates, and partitioning of deformation in Japan, Journal of Geophysical Research.

By Jimbo Wilson, Software Engineer, Big Picture Team and Brendan Meade, Professor, Harvard Department of Earth and Planetary Sciences

.